 Global| Feb 23 2009
Can The Baltic States Hold Their Currency Pegs?
Summary
The Baltic States--Estonia, Latvia and Lithuania--have, in recent years, pegged their currencies to the euro. Until recently, this arrangement had proved economically satisfactory to the three nations. However, as the deterioration in [...]

The Baltic States--Estonia, Latvia and Lithuania--have, in
recent years, pegged their currencies to the euro. Until recently, this
arrangement had proved economically satisfactory to the three nations.
However, as the deterioration in the world wide economy began to affect
these countries, the fact that their currencies were pegged to a
strengthening euro only exacerbated their problems.
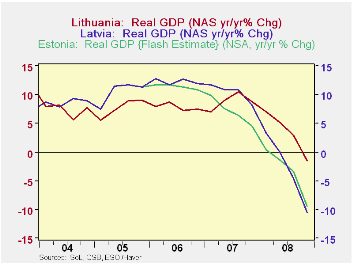
The first chart shows the year over year changes in real GDP for the three countries. Final data for the fourth quarter of 2008 for Estonia are not yet available, but the preliminary "flash" estimate is for a decline of 9.4% from the fourth quarter of 2007. Published data for Latvia's fourth quarter GDP shows a year over year decline of 10.5% while that for Lithuania's GDP is only 1.5%.
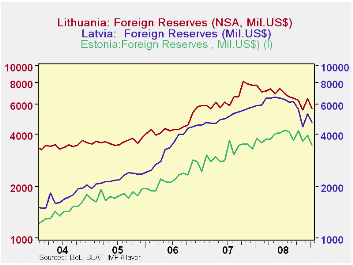
All three countries have used their foreign reserves to maintain their pegs with the euro as can be seen in the second chart that shows the recent declines in the foreign reserves of the three countries. Latvia spent more than $1.5 billion of its foreign reserves, defending its currency and was forced to apply for help from an International Monetary Fund led group for a $9.6 billion bailout. Both Latvia and Lithuania have cut wages of state employees Latvia by 15% and Lithuania by 12%. Now, Estonia is considering wage cuts of 10% for state employees except policemen and teachers. These measures have led to riots and political unrest. Once again the permanency of currency board systems in the face of austerity is being tested.
| BALTIC STATES | Jan 09 | Dec 08 | Nov 08 | Oct 08 | Sep 08 |
|---|---|---|---|---|---|
| Foreign Reserves (Mil. USD) | |||||
| Lithuania | 5683 | 6441 | 5537 | 6340 | 6505 |
| Latvia | 4695 | 5248 | 4447 | 5592 | 6239 |
| Estonia | 3462 | 3971 | 3646 | 4183 | 3681 |
| Q4 08 | Q3 08 | Q2 08 | Q1 08 | ||
| Year over Year Chg in Real GDP % | |||||
| Lithuania | -1.48 | 2.95 | 5.19 | 7.01 | -- |
| Latvia | -10.50 | -4.57 | 0.07 | 3.31 | -- |
| Estonia | -9.4 | -3.3 | -1.4 | 0.4 | -- |


