 Global| Mar 01 2010
Canada's Q4 GDP Rise Due Mainly To Foreign Trade Trends
Summary
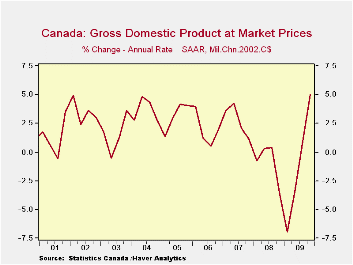
The Canadian economy grew at a 5% annual rate in the fourth of last year. It was the second quarter of growth following the three quarter recession and represented a substantial acceleration from the 0.94% seasonally adjusted annual [...]

The Canadian economy grew at a 5% annual rate in the fourth of last year. It was the second quarter of growth following the three quarter recession and represented a substantial acceleration from the 0.94% seasonally adjusted annual rate of the third quarter, as can be seen in the attached chart.
In addition to the rate of growth, the composition of the growth is particularly important for monetary policy decisions. Statistics Canada provides a table showing the composition of the quarter to quarter changes in real GDP. This table can be found in the National Accounts section of the Haver Analytics data base, CANSIM. The components of the table are listed below.
The acceleration in growth in the fourth quarter was due largely to trends in foreign trade. Exports of goods and services were greater and imports of goods and services were sharply lower than those in the third quarter. As imports detract from growth, a reduction in imports from one quarter to the next leads to a higher GDP. The contribution of domestic demand was much smaller than it was in the third quarter. Personal and government consumption and business and government investment all showed lower growth in the fourth quarter than in the third. Thus in spite of the 5% annual rate of increase in the fourth quarter, there is little evidence that the economy is overheating.
| Contribution to Q/Q Percent Change in GDP | Q4 09 | Q3 09 | Q2 09 | Q3 09 | Q4 08 |
|---|---|---|---|---|---|
| Q/Q Percent Change in GDP | 1.233 | 0.235 | -0.875 | -1.785 | -0.940 |
| Personal Consumption Expenditures | 0.517 | 0.530 | 0.238 | -0.191 | -0.443 |
| Govt. Current Expenditures | 0.309 | 0.332 | 0.181 | 0.104 | 0.121 |
| Govt. Investment in Inventory | 0.002 | 0.001 | 0.000 | -0.007 | 0.012 |
| Govt. Fixed Investment | 0.155 | 0.223 | 0.154 | 0.07 | 0.072 |
| Business Investment in Inventory | -0.181 | 0.329 | 0.082 | -1.193 | -0.305 |
| Business Fixed Investment | 0.188 | 0.323 | -0.505 | -1.909 | -0.992 |
| Exports of Goods and Services | 1.027 | 0.804 | -1.526 | -2.863 | -1.707 |
| Imports of Goods and Services | -0.653 | -2.313 | 0.443 | 4.035 | 2.292 |
| Statistical Discrepancy | -0.131 | 0.007 | 0.058 | 0.131 | 0.003 |
| Final Domestic Demand | 0.952 | 5.352 | 7.944 | -2.700 | -5.420 |
More Economy in Brief
 Global| Feb 05 2026
Charts of the Week: Balanced Policy, Resilient Data and AI Narratives
by:Andrew Cates


