 Global| Nov 17 2009
Canadian Manufacturing Data And Prospects For Q3 GDP
Summary
The news from Canada continues to raise doubts about the forecast of a 2% rise in GDP in the third quarter made earlier by Mark Carney, Governor of the Bank of Canada. Monthly GDP declined in July and August. The continued strength of [...]
 The news
from Canada continues to raise doubts about the forecast of a 2% rise
in GDP in the third quarter made earlier by Mark Carney, Governor of
the Bank of Canada. Monthly GDP declined in July and August.
The continued strength of the C$ is affecting
exports.
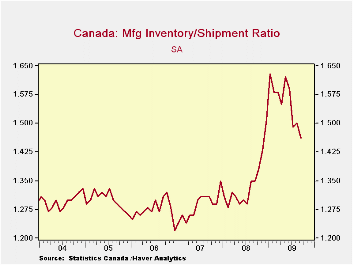
Today, data on sales, new and unfilled orders and inventories were released for the manufacturing sector and they were mixed. Manufacturing sales were lower than expected but the pace of new orders and inventories was more encouraging. New orders increased 8.3% in September after having declined in July and August. Inventories continue to decline and the inventory sales ratio is now down to 1.46 from it peak of 1.63 in January of this year. The ratio is shown in the first chart and is approaching what looks like a normal ratio of around 1.30.
 While there may be some doubts about the
magnitude of the rise in Canada's third quarter GDP, there is no doubt
that the Canadian economy is at a turning point and will show some
growth in the third quarter. Most of the data relating to the
Canadian economy released recently has been erratic--a step forward,
then some retraction. Nevertheless, the forward momentum has
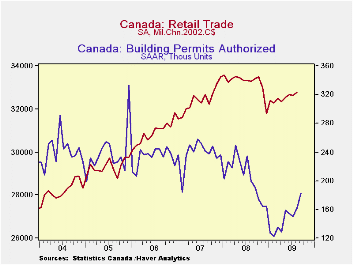
generally overcome the retraction. In addition to
manufacturing sales, the number of building permits authorized and
retail sales are good examples of such data and they are shown in the
second chart. Recent changes in both series are volatile, but
the trend for both is clearly positive.
| Manufacturing | Sep 09 | Aug 09 | Jul 09 | Jun 09 | May 09 | Apr 09 |
|---|---|---|---|---|---|---|
| Shipments (M/M % Chg) | 1.43% | -1.77% | 5.17% | 3.28% | -4.44% | -0.36% |
| New Orders (M/M % Chg) | 8.26% | -1.20% | -5.68% | 20.38% | -6.29% | -11.16% |
| Unfilled Orders (M/M % Chg) | -0.57% | -5.06% | -5.26% | 2.11% | -7.04% | -5.88% |
| Inventories (M/M Change in Mil. C$) | -1166.909 | -299.573 | -1257.203 | -160.873 | -1117.464 | -719.741 |
| Inventories/Sales Ratio | 1.46 | 1.50 | 1.49 | 1.59 | 1.62 | 1.55 |
More Economy in Brief
 Global| Feb 05 2026
Charts of the Week: Balanced Policy, Resilient Data and AI Narratives
by:Andrew Cates


