 Global| Dec 26 2009
Case-Shiller Home Price Gains AreModest
by:Tom Moeller
|in:Economy in Brief
Summary
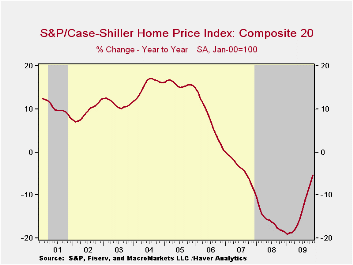
The housing market has improved enough to improve pricing power but outright strength is not at hand. The November S&P/Case Shiller Home Price Index edged up another 0.2%, about as it did during the prior two months. The increases in [...]
 The
housing
market has improved enough to improve pricing power but outright
strength is not at hand. The November S&P/Case Shiller Home
Price Index edged up another 0.2%, about as it did during the prior two
months. The increases in this 20 City Composite index were below those
during the prior three months. However, they were enough to improve the
y/y comparison to -5.3% from its worst of -19.0% last January.
The
housing
market has improved enough to improve pricing power but outright
strength is not at hand. The November S&P/Case Shiller Home
Price Index edged up another 0.2%, about as it did during the prior two
months. The increases in this 20 City Composite index were below those
during the prior three months. However, they were enough to improve the
y/y comparison to -5.3% from its worst of -19.0% last January.
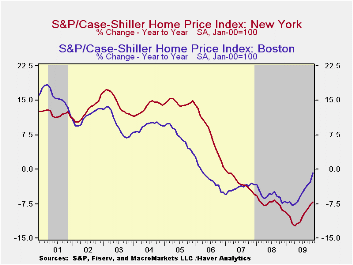
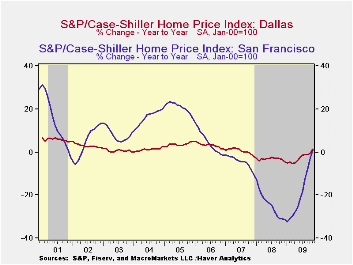
The narrower 10 City Composite Index also gained 0.2% and the y/y change improved to -4.5% from -19.4% at its worst. These negative comparisons by far outpace those during the 1990-91 recession which reached minus 6.3%.· Notable monthly gains in home prices during November were logged by Los Angeles, San Diego and San Francisco. Positive changes also were logged in Dallas.
The Case Shiller home price series are value-weighted, i.e., a greater index weight is assigned to more expensive homes. The S&P/Case-Shiller home price series can be found in Haver's USECON database and the city data highlighted below is in the REGIONAL database.
| S&P/Case-Shiller Home Price Index (SA, Jan 00 = 100) | November m/m | October m/m | September m/m | Nov. y/y | 2008 | 2007 | 2006 |
|---|---|---|---|---|---|---|---|
| 20 City Composite Index | 0.2% | 0.3% | 0.1% | -5.3% | -15.7% | -3.8% | 7.6% |
| Regional Indicators | |||||||
| Atlanta | 0.2 | -0.4 | 0.1 | -6.2 | -8.5 | 0.7 | 4.3 |
| Boston | 0.4 | -0.2 | -0.5 | -0.7 | -5.7 | -4.0 | -1.8 |
| Chicago | -0.8 | -1.0 | 1.2 | -8.5 | -10.0 | -1.0 | 6.6 |
| Dallas | 0.6 | 0.2 | -0.3 | 1.4 | -3.2 | 0.5 | 3.2 |
| Denver | 0.3 | 0.3 | 0.0 | 0.5 | -4.9 | -1.7 | 2.1 |
| Los Angeles | 1.0 | 0.7 | 0.7 | -3.5 | -24.2 | -5.2 | 11.6 |
| New York | -0.9 | -0.3 | -0.2 | -7.1 | -7.4 | -2.8 | 7.5 |
| San Francisco | 1.5 | 1.8 | 1.5 | 1.0 | -24.3 | -4.5 | 4.5 |
by Tom Moeller December 26, 2009
 The
consumer's mood regarding the economy has improved, but after the jump
last spring little headway developed. The Conference Board indicated
that consumer confidence during January rose 4.3% from December after
similar gains during the prior two months. Due to earlier declines,
however, these increases left confidence roughly equal to last May. The
Conference Board data can be found in Haver's CBDB
database.
The
consumer's mood regarding the economy has improved, but after the jump
last spring little headway developed. The Conference Board indicated
that consumer confidence during January rose 4.3% from December after
similar gains during the prior two months. Due to earlier declines,
however, these increases left confidence roughly equal to last May. The
Conference Board data can be found in Haver's CBDB
database.
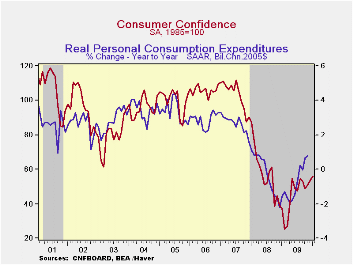
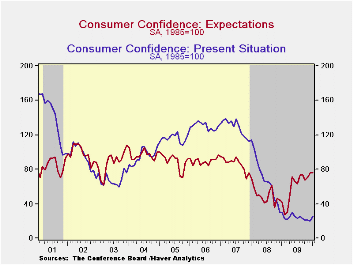
Despite the loss of forward momentum confidence remained up roughly one-half from last January. During the last ten years there has been an 87% correlation between the level of consumer confidence and the y/y change in real consumer spending.
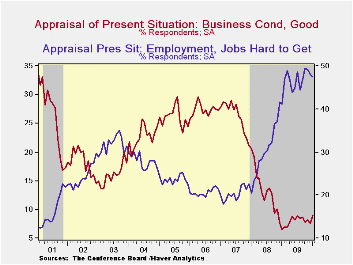
Consumers' assessment of the current economic conditions jumped by one-quarter this month but only back to last summer's high. It remained near the historic low. Jobs were seen as hard to get by 47.4% of respondents and jobs were seen as plentiful by only 4.3%. That was up just slightly from the series' historic low. Business conditions were seen as good by only 9.0% and that also was near the series' low. Consumers who thought business conditions were bad rose slightly to 46.1%. While off somewhat from its high the reading was still nearly the highest since 1983. · The expectations component of confidence improved slightly m/m and the index remained near the highest level since late-2007. Most expected business conditions & employment to remain the same and that's a vast improvement from the deterioration seen last winter. Expectations for the inflation rate in twelve months held stable at 5.3%, the lowest level since 2007 and down from last year's high of 7.7%. Interest rates in twelve months were expected to be higher by an increased 52.3% of respondents, while a reduced 12.5% expected rates to fall. A greatly increased 36.3% of respondents expected stock prices to rise.
Consumers continued to manage their spending plans cautiously. A reduced 1.8% plan to buy a home during the next six months while just 24.7% plan to buy a major appliance. That's versus 30.9% back in 2007. Only 5.1% plan to buy an automobile versus 6.0% in 2007. Just 2.0% plan to buy a new one.
Real Time Underlying Inflation Gauges for Monetary Policymakers from the Federal Reserve Bank of New York is available here.
| Conference Board (SA, 1985=100) | January | December | November | Y/Y % | 2009 | 2008 | 2007 |
|---|---|---|---|---|---|---|---|
| Consumer Confidence Index | 55.9 | 53.6 | 50.6 | 49.5 | 45.2 | 57.9 | 103.4 |
| Present Situation | 25.0 | 20.2 | 21.2 | -15.8 | 24.0 | 69.9 | 128.8 |
| Expectations | 76.5 | 75.9 | 70.3 | 80.0 | 59.3 | 50.0 | 86.4 |
by Louise Curley December 26, 2009
 German
business confidence improved in January in contrast to that of
investors and consumers, but it is still relatively subdued.
The IFO institute, which surveys some 7000 executives in manufacturing,
construction, wholesale and retail trade, reports its results in two
ways: in index form with (2000=100) and as a percent balance between
those who see improvement and those who see deterioration.
The index is useful in tracking the ups and downs in confidence, but
the percent balances give some insight into the degree of confidence of
the participants. For example, in January, the
index of current conditions increased to 91.2 from 90.4 in December and
the percent balance increased to -21.0% from -22.6%. Thus
both measures showed an improvement in the appraisal of current
conditions, but the percent balance also showed that there were still
21% more respondents who appraised current conditions negatively than
those who appraised them positively.
German
business confidence improved in January in contrast to that of
investors and consumers, but it is still relatively subdued.
The IFO institute, which surveys some 7000 executives in manufacturing,
construction, wholesale and retail trade, reports its results in two
ways: in index form with (2000=100) and as a percent balance between
those who see improvement and those who see deterioration.
The index is useful in tracking the ups and downs in confidence, but
the percent balances give some insight into the degree of confidence of
the participants. For example, in January, the
index of current conditions increased to 91.2 from 90.4 in December and
the percent balance increased to -21.0% from -22.6%. Thus
both measures showed an improvement in the appraisal of current
conditions, but the percent balance also showed that there were still
21% more respondents who appraised current conditions negatively than
those who appraised them positively.
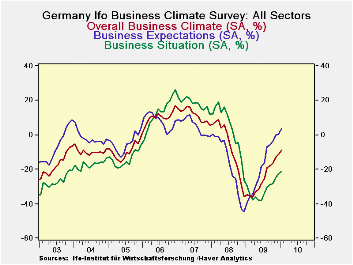
The IFO's headline measure of confidence, the Business Climate for all industry, is a combination of the replies of the participants regarding current conditions and expectations for the future. The percent balances for the Business Climate, Current Conditions and Expectations for the future are shown in the first chart.
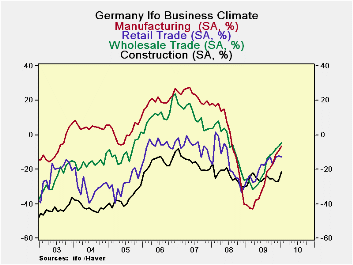
The Business Climate for all industry has improved steadily since March of this year when it was -42.8% to -9.0% in January. There has been little change in construction climate. The pessimists still exceed the optimists by 21.5%. The climate in retail trade has fared better than that of construction, but the pessimists still exceed the optimists by 12.8%. The strongest improvements in confidence have taken place in manufacturing and wholesale trade climates, where the pessimists now exceed the optimists by only 4.7% in wholesale trade and 6.6% in manufacturing. These trends are shown in the second chart.
Most of the percent balance data in the latest survey are still negative indicating that the predominant mood of most German business executives is still pessimistic, or at best, skeptical. There is, however, one notable change. The latest survey shows that, for the first time since August 2007, there is a small, but significant, excess, 3.7%, of optimists over pessimists regarding business expectations. In November there was a balance between optimists and pessimists and in December an excess of optimists of 0.2%.
| IFO Business Survey (% balance) | Jan 10 | Dec 09 | Nov 08 | Oct 09 | Sep 09 | Aug 09 | Jul 09 | Jun 09 |
|---|---|---|---|---|---|---|---|---|
| Business Climate | -9.0 | -11.5 | -12.9 | -16.5 | -17.8 | -19.2 | -25.4 | -28.4 |
| Current Conditions | -21.0 | -22.6 | -24.9 | -28.4 | -29.0 | -30.6 | -34.1 | -38.1 |
| Expectations | 3.7 | 0.2 | 0.0 | -3.9 | -5.9 | -7.0 | -16.1 | -18.1 |
| Business Climate | ||||||||
| Manufacturing | -6.6 | -9.3 | -11.4 | -16.5 | -19.4 | -21.2 | -29.0 | -33.1 |
| Construction | -21.5 | -26.8 | -27.3 | -25.2 | -25.6 | -23.8 | -25.2 | -23.7 |
| Wholesale Trade | -4.7 | -6.9 | -8.1 | -10.6 | -12.0 | -14.0 | -21.8 | -24.9 |
| Retail Trade | -12.8 | -12.3 | -12.9 | -17.0 | -12.6 | -14.9 | -17.6 | -17.1 |
by Tom Moeller December 26, 2009
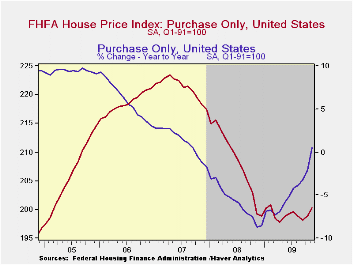
The HPI is calculated using a repeat sales index. That means that the HPI measures changes in the price of the same property over time but does not measure changes in property types over time. So if, for example, the price of a larger, new home was not growing very rapidly, but the number of people transitioning from smaller homes to larger homes greatly increased, median house prices would go up (people buying more expensive houses) much more than the HPI. In this way, the HPI is a better measure of how any particular home is appreciating while the median house price is a better measure of what the typical home buyer is paying.
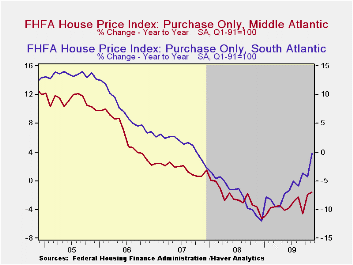
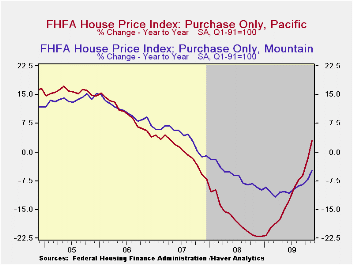
Notable monthly gains in home prices during November were logged in the Pacific, South Atlantic and Mountain regions of the country and the y/y declines moderated significantly.
| FHFA U.S. House Price Index Purchase Only (%) | November | October | September | Y/Y | 2008 | 2007 | 2006 |
|---|---|---|---|---|---|---|---|
| Total | 0.7 | 0.4 | -0.3 | 0.5 | -5.8 | 1.3 | 6.0 |
| New England | -0.3 | 0.7 | 0.5 | 0.3 | -4.7 | -1.7 | 1.1 |
| Middle Atlantic | -0.1 | 1.3 | -1.3 | -1.6 | -2.3 | 1.9 | 6.3 |
| East North Central | 0.1 | -0.9 | 0.9 | 0.1 | -4.4 | -1.3 | 1.8 |
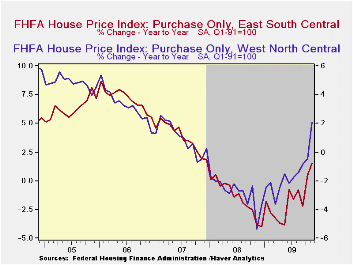
| West North Central | -0.0 | 0.4 | -0.0 | 2.1 | -2.8 | 1.0 | 3.2 |
| South Atlantic | 2.0 | -1.5 | 0.0 | -0.1 | -7.3 | 1.3 | 7.1 |
| East South Central | -0.4 | 2.3 | -1.6 | 1.5 | -1.5 | 3.8 | 7.2 |
| West South Central | 0.3 | 0.6 | -0.3 | 2.5 | 0.6 | 4.7 | 7.2 |
| Mountain | 0.7 | 0.7 | -1.3 | -4.9 | -6.2 | 3.9 | 10.6 |
| Pacific | 2.3 | 2.2 | -0.8 | 2.9 | -17.3 | 0.1 | 9.8 |

Tom Moeller
AuthorMore in Author Profile »Prior to joining Haver Analytics in 2000, Mr. Moeller worked as the Economist at Chancellor Capital Management from 1985 to 1999. There, he developed comprehensive economic forecasts and interpreted economic data for equity and fixed income portfolio managers. Also at Chancellor, Mr. Moeller worked as an equity analyst and was responsible for researching and rating companies in the economically sensitive automobile and housing industries for investment in Chancellor’s equity portfolio. Prior to joining Chancellor, Mr. Moeller was an Economist at Citibank from 1979 to 1984. He also analyzed pricing behavior in the metals industry for the Council on Wage and Price Stability in Washington, D.C. In 1999, Mr. Moeller received the award for most accurate forecast from the Forecasters' Club of New York. From 1990 to 1992 he was President of the New York Association for Business Economists. Mr. Moeller earned an M.B.A. in Finance from Fordham University, where he graduated in 1987. He holds a Bachelor of Arts in Economics from George Washington University.
More Economy in Brief

 Global| Feb 05 2026
Charts of the Week: Balanced Policy, Resilient Data and AI Narratives
by:Andrew Cates

