 Global| Jan 24 2006
Chain Store Sales Edged Up, With Gasoline Prices
by:Tom Moeller
|in:Economy in Brief
Summary
Chain store sales edged 0.3% higher last week following the sharp 1.4% drop during the prior period, according to the International Council of Shopping Centers (ICSC)-UBS survey. The increase left sales in January 1.3% ahead of [...]
Chain store sales edged 0.3% higher last week following the sharp 1.4% drop during the prior period, according to the International Council of Shopping Centers (ICSC)-UBS survey.
The increase left sales in January 1.3% ahead of December.
The leading indicator of chain store sales slipped 0.1% following two weeks of strong increase and the January average remained 1.2% ahead of December which rose 0.8%.The ICSC-UBS retail chain-store sales index is constructed using the same-store sales (stores open for one year) reported by 78 stores of seven retailers: Dayton Hudson, Federated, Kmart, May, J.C. Penney, Sears and Wal-Mart.
Redbook Research reported that chain store sales in January were 0.4% below (+3.6% y/y) December. The Redbook survey samples same-store sales at general merchandise retailers representing about 9,000 stores. Same-store sales measure revenue at stores open at least a year.
During the last ten years there has been a 67% correlation between the y/y change in the Redbook tally of chain store sales and the change in non-auto retail sales less gasoline.
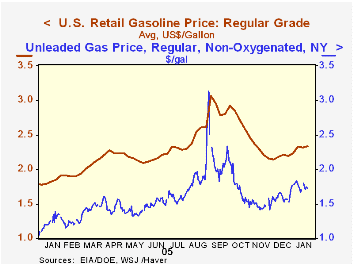
The latest store sales were accompanied by another rise in gasoline prices at the pump. Last week's two cent increase to an average $2.34 per gallon of regular unleaded followed a slight dip the prior week and pulled the January average to $2.31. In spot market trading yesterday gasoline fell three cents after a four cent rise on Friday, but declines early last week left the latest level two cents below last week's average.
| ICSC-UBS (SA, 1977=100) | 01/21/06 | 01/14/06 | Y/Y | 2005 | 2004 | 2003 |
|---|---|---|---|---|---|---|
| Total Weekly Chain Store Sales | 459.0 | 457.7 | 3.3% | 3.6% | 4.7% | 2.9% |
by Louise Curley January 24, 2006
Last week Carol Stone commented on the signs of weakness in the United Kingdom's economy. Lower employment, reduced confidence, declining orders and industrial production. Today the Confederation of British Industries cast further gloom with the releases of their monthly and quarterly surveys of industrial trends. The latest survey was conducted between December 12, 2005 and January 11, 2006. During this period the pound averaged $1.75 and the price of Brent crude averaged $59.02 per barrel.
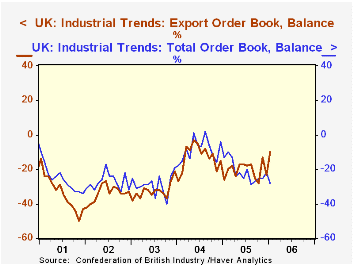
The balance between those reporting an increase in orders and those reporting a decrease was -28% in January, 6 percentage points more negative than December and 15 percentage points more negative than January, a year ago. Export orders fared somewhat better. The balance between those reporting an increase in export orders and those reporting a decrease was -10 0% in January, significant improvements from the -23% in December and the -26% in January, 2005. There have been very few months in the past five years when the balances on the total order book or the export order book have been positive, as can be seen in the first chart. In general more manufacturers have reported decreases in orders than have reported increases over this period.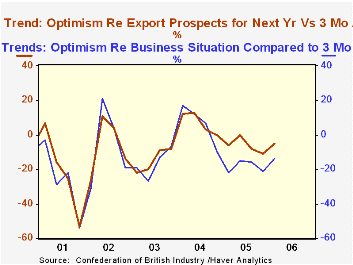
While there has been a slight decline in pessimism in the current quarter survey, pessimists continue to outweigh the optimists, as they have since late 2004. The balance of those expecting an improvement in the business situation was -14% in the first quarter, compared with -21% in the fourth quarter, 2005 and -22% in the first quarter, 2005. Again, there is a somewhat better outlook for the export situation. The balance of those expecting a decrease in the export situation was -5% in the first quarter, an improvement from the -11% of the fourth quarter. The balances for optimism for the whole economy and for exports are shown in the second chart.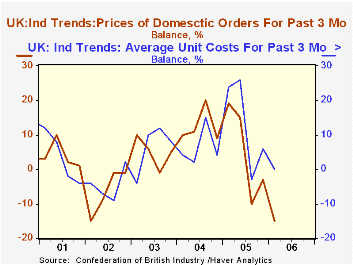
Manufacturers are having trouble passing higher input prices on to the final consumer. Although there was some reduction in the balance of those expecting lower final prices in the first quarter to -4% from -8% in the fourth quarter of 2005, there was an increase to 23% in the balance of those expecting higher costs. Since early last year, the year over year increases in costs have exceeded those of final prices as can be seen in the third chart.
| Confederation of British Industries (% Balances) | Q1 06 % | Q4 05 % | Q1 05 % | Q/Q dif | Y/Y dif | 2005 % | 2004 % | 2003 % |
|---|---|---|---|---|---|---|---|---|
| Optimism -General Business Situation | -14 | -21 | -22 | 7 | 8 | -19 | 7 | -17 |
| Optimism-Exports | -5 | -11 | -6 | 6 | 1 | -6 | 7 | -1 |
| Prices | -4 | -8 | 11 | 4 | -15 | 2 | -4 | -16 |
| Costs | 23 | 20 | 23 | 3 | 0 | 22 | 9 | 3 |
| Jan 06 % | Dec 05 % | Jan 05 % | M/M dif | Y/Y dif | 2005 % | 2004 % | 2003 % | |
| Total Order Book | -28 | -22 | -13 | -6 | -15 | -21 | -9 | -29 |
| Export Order Book | -10 | -23 | -26 | 13 | 16 | -21 | -13 | -33 |

Tom Moeller
AuthorMore in Author Profile »Prior to joining Haver Analytics in 2000, Mr. Moeller worked as the Economist at Chancellor Capital Management from 1985 to 1999. There, he developed comprehensive economic forecasts and interpreted economic data for equity and fixed income portfolio managers. Also at Chancellor, Mr. Moeller worked as an equity analyst and was responsible for researching and rating companies in the economically sensitive automobile and housing industries for investment in Chancellor’s equity portfolio. Prior to joining Chancellor, Mr. Moeller was an Economist at Citibank from 1979 to 1984. He also analyzed pricing behavior in the metals industry for the Council on Wage and Price Stability in Washington, D.C. In 1999, Mr. Moeller received the award for most accurate forecast from the Forecasters' Club of New York. From 1990 to 1992 he was President of the New York Association for Business Economists. Mr. Moeller earned an M.B.A. in Finance from Fordham University, where he graduated in 1987. He holds a Bachelor of Arts in Economics from George Washington University.
More Economy in Brief


