 Global| Nov 07 2005
Challenger Layoffs Up Again in October, Trend Lower
by:Tom Moeller
|in:Economy in Brief
Summary
Last week, Challenger, Grey & Christmas reported that job cut announcements in October rose for the second consecutive month. The 13.2% m/m rise to 81,301 nevertheless left the three month average of job cut announcements down 8.8% at [...]
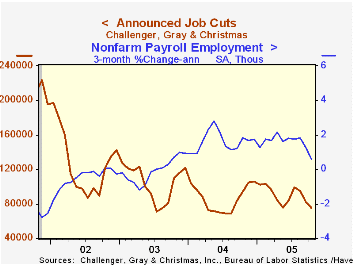
Last week, Challenger, Grey & Christmas reported that job cut announcements in October rose for the second consecutive month. The 13.2% m/m rise to 81,301 nevertheless left the three month average of job cut announcements down 8.8% at 74,569 (-21.2% y/y), the lowest level since August of last year.
During the last ten years there has been an 84% (inverse) correlation between the three month moving average of announced job cuts and the three month change payroll employment.
Job cut announcements differ from layoffs. Many are achieved through attrition, early retirement or just never occur.
Increases in job cut announcements m/m were reported in apparel (65.5% y/y), automotive (11.5% y/y), insurance (272.2% y/y) and telecommunications (-28.5% y/y) pharmaceutical (37.0% y/y) industries although declines were noted in consumer goods (-45.0% y/y), electronics (-48.3% y/y), financial (-78.2% y/y) and retail (+118.0% y/y).
Challenger also reported that announced hiring plans also rose to a level up sharply from last October.
The Yield Curve as a Leading Indicator: Frequently Asked Questions answered by the Federal Reserve Bank of New York is available here.
Last week's comments from Federal Reserve Board Vice Chairman Roger W. Ferguson, Jr. at the Cato Institute titled Monetary Credibility, Inflation, and Economic Growth can be found here.
| Challenger, Gray & Christmas | Oct | Sept | Y/Y | 2004 | 2003 | 2002 |
|---|---|---|---|---|---|---|
| Announced Job Cuts | 81,301 | 71,836 | -20.2% | 1,039,175 | 1,236,426 | 1,431,052 |
by Louise Curley November 7, 2005
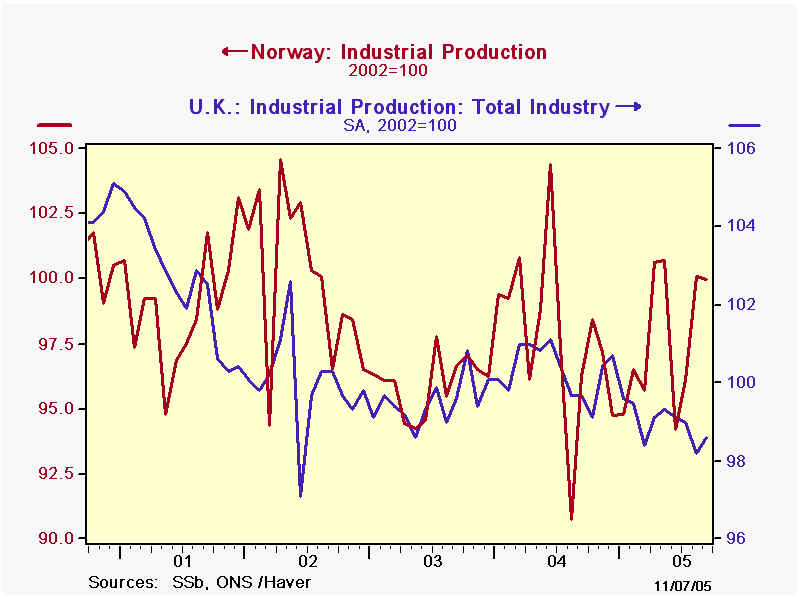
September industrial production data for Germany, Denmark, Norway and the United Kingdom were released today. All, except Norway showed a rise in total production from August and all except the UK were higher than September, 2004. Manufacturing production increased in Germany and Norway, but declined in the UK. (Data on total manufacturing are not available for Denmark.)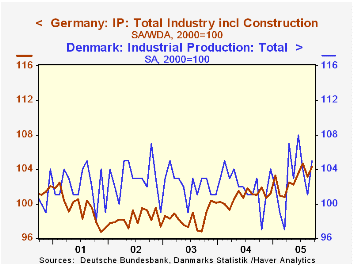
The August decline in manufacturing in the UK was more than offset by a sharp increase of 6.69% in the mining and refining sector, where activity in the oil industry is recorded. Although England's oil industry has been declining it is still a significant factor in overall production. The oil industry is even more important in Norway and the swings in oil production there have had a more pronounced effect on total production. The first chart compares total production in the UK and in Norway. (In order to facilitate the comparison between Norwegian and the UK production indexes, we have rebased the original Norwegian data based on 1995=100 to 2002=100, the basis for the UK index. This can be done easily in DXLVG3, using the advanced functions.)
Industrial production in Denmark for the past five years has shown little evidence of a trend, but it has been extremely volatile even on a seasonally adjusted basis. Germany, by contrast has shown a moderately rising trend and less volatility as can be seen in the second chart.
| Industrial Production | Sep 05 | Aug 05 | Sep 04 | M/M % | Y/Y % | 2004 | 2003 | 2002 |
|---|---|---|---|---|---|---|---|---|
| Germany (2000=100) | ||||||||
| Total | 104.3 | 103.1 | 101.0 | 1.16 | 3.27 | 100.8 | 98..4 | 98.3 |
| Manufacturing | 107.3 | 105.9 | 103.2 | 1.32 | 3.97 | 102.7 | 99.5 | 99.3 |
| Denmark 2000=100) | ||||||||
| Total | 105 | 101 | 103 | 3.96 | 1.94 | 102 | 102 | 103 |
| United Kingdom (2002=100) | ||||||||
| Total | 98.6 | 98.2 | 99.7 | 0.41 | -1.10 | 100.3 | 99.5 | 100.0 |
| Mining and Quarrying | 78.3 | 76.2 | 81.3 | 6.69 | -3.94 | 87.2 | 94.9 | 100.0 |
| Manufacturing | 101.4 | 101.7 | 102.1 | -0.29 | -0.69 | 102.0 | 100.1 | 100.0 |
| Norway (2002=100) | ||||||||
| Total | 100.0 | 100.1 | 96.3 | -0.09 | 3.86 | 97.8 | 96.0 | 100.0 |
| Mining and Quarrying | 94.3 | 94.9 | 98.7 | -0.62 | -4.40 | 100.8 | 105.7 | 100.0 |
| Manufacturing | 99.8 | 97.6 | 97.9 | 2.23 | 1.92 | 97.1 | 95.8 | 100.0 |

Tom Moeller
AuthorMore in Author Profile »Prior to joining Haver Analytics in 2000, Mr. Moeller worked as the Economist at Chancellor Capital Management from 1985 to 1999. There, he developed comprehensive economic forecasts and interpreted economic data for equity and fixed income portfolio managers. Also at Chancellor, Mr. Moeller worked as an equity analyst and was responsible for researching and rating companies in the economically sensitive automobile and housing industries for investment in Chancellor’s equity portfolio. Prior to joining Chancellor, Mr. Moeller was an Economist at Citibank from 1979 to 1984. He also analyzed pricing behavior in the metals industry for the Council on Wage and Price Stability in Washington, D.C. In 1999, Mr. Moeller received the award for most accurate forecast from the Forecasters' Club of New York. From 1990 to 1992 he was President of the New York Association for Business Economists. Mr. Moeller earned an M.B.A. in Finance from Fordham University, where he graduated in 1987. He holds a Bachelor of Arts in Economics from George Washington University.
More Economy in Brief

 Global| Feb 05 2026
Charts of the Week: Balanced Policy, Resilient Data and AI Narratives
by:Andrew Cates

