 Global| Feb 14 2011
China: Exports Fall, Imports Rise. Result a Smaller Surplus
Summary
China reported a trade surplus of $6.5 billion for January, a decline of $6.6 billion from December, 2010 and $7.7 billion below January of a year ago. The decline from December was the result of 2.2% decline in exports and a 2.3% [...]
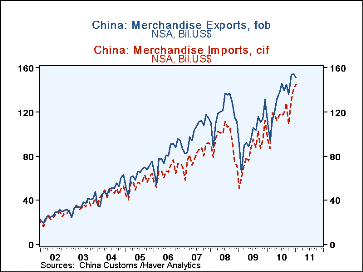
China reported a trade surplus of $6.5 billion for January, a decline of $6.6 billion from December, 2010 and $7.7 billion below January of a year ago. The decline from December was the result of 2.2% decline in exports and a 2.3% increase in imports. Data at the beginning of the year are affected not only by seasonal factors but the Chinese New Year, the effect of which is often felt in anticipation of the event, the week of the event and, perhaps some after effects. This year the Chinese New Year began on February 2 and it is possible that it has had some effect on the January data. Haver Analytics adjusts the data for seasonality and the Chinese New Year. The adjusted data show substantial increases in exports and imports in contrast to the small decline in the unadjusted exports and the small increase in the unadjusted imports. The unadjusted data are show in the first chart and in the table below compared with the adjusted data.
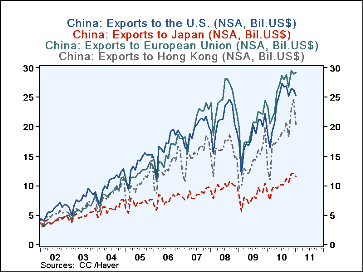
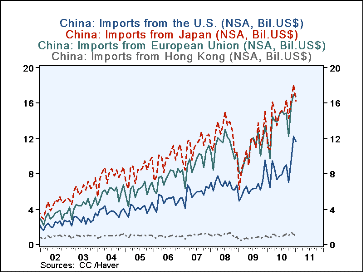
January trade data by country are available for only a limited number of countries and areas at this time. Among the countries for which data are available, are Japan and Hong Kong, representing Asia, the total for the European Union and the United States. Chinese exports to the EU total and other countries are shown in the second chart. Chinese imports from these countries are shown in the third chart. There is a small increase in exports to the European Union but declines in the other areas. The increase in total imports has not come from these areas--all show declines.
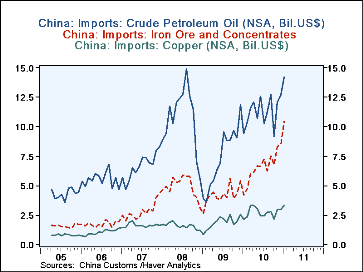
Instead of looking at the countries as the source of imports, one can look at the goods imported. Like the data on trade by country, the January trade data on goods are only partially available at this time. The data on the volume and value of Major commodities that are available show that it is probable that imports of basic materials have been the chief cause of the January rise in imports. Crude petroleum, iron ore and copper were up sharply in January as can be seen in the fourth chart. These products have been imported from the Middle East, Latin American and other countries whose total trade with China have yet to be reported.
| Jan 11 | Dec 10 | Jan10 | M/M% | Y/Y% | 2010 | 2009 | 2008 | |
|---|---|---|---|---|---|---|---|---|
| Trade in Goods (NSA,Bil. US$) | ||||||||
| Exports | 150.7 | 154.2 | 109.5 | -2.22 | 37.82 | 1578.4 | 1201.6 | 1429.5 |
| Imports | 144.3 | 141.2 | 95.4 | 2.27 | 51.23 | 1394.0 | 1006.1 | 1132.3 |
| Balance | 6.5 | 13.1 | 14.1 | -6.6* | -7.7* | 184.4 | 195.5 | 297.2 |
| Trade in Goods (SA,Bil. US$) | ||||||||
| Exports | 165.7 | 143.7 | 116.7 | 15.32 | 41.93 | 1571.8 | 1195.8 | 1428.0 |
| Imports | 160.2 | 129.7 | 163.7 | 23.54 | 54.60 | 1390.2 | 998.7 | 1134.6 |
| Balance | 5.4 | 13.9 | 13.1 | -8.5* | -7.6* | 181.6 | 197.7 | 293.4 |
| * Billions of US$ | ||||||||
More Economy in Brief
 Global| Feb 05 2026
Charts of the Week: Balanced Policy, Resilient Data and AI Narratives
by:Andrew Cates


