 Global| Feb 12 2007
China off to Another Record Trade Balance
Summary
China is one of the first countries to announce its monthly trade data. Selected trade data on a seasonally unadjusted basis for January were released today. In each year since 2001 the unadjusted data on the trade balance have shown [...]

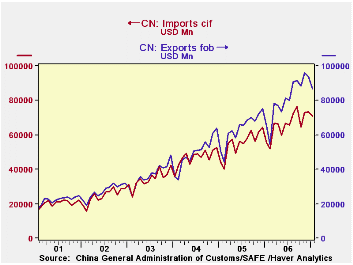
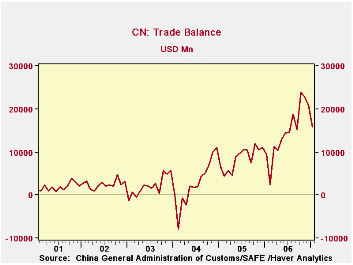
China is one of the first countries to announce its monthly trade data. Selected trade data on a seasonally unadjusted basis for January were released today. In each year since 2001 the unadjusted data on the trade balance have shown a sharp decline from the last quarter of the year to the first quarter of the next. Such appears to be the case this year as the January trade balance was $15.9 billion, 24.4% below December, 2006. Compared to the balance last January, however, the increase was 67.4%, suggesting that China is off to setting another record balance of trade this year. A dramatic change in the yuan/dollar relationship could change this outlook, but such a change does not appear likely at this time. The Group of 7 meeting in Germany last weekend merely appealed to China to increase its currency flexibility. The first chart shows China's exports and imports of goods. The widening gap between the two--the balance of trade is shown in the second chart.
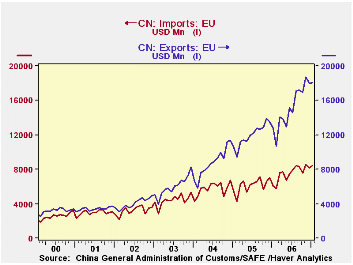
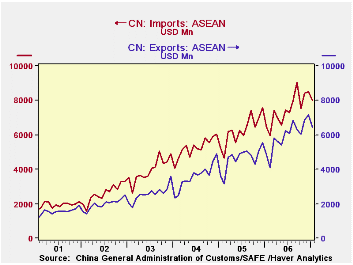
The only geographical areas where export and import data are available for January are the EU and the Association of South Eastern Nations (ASEAN). (ASEAN consist of: Brunei, Cambodia, Indonesia, Laos, Malaysia, Myanmar, Philippines, Singapore, Thailand and Vietnam.) The increasing surplus with the EU is evident in the third chart. One of the few areas where China has a deficit is with ASEAN. The deficit with ASEAN is shown in the fourth chart. The excess of imports from ASEAN over exports to the area appears to be declining gradually over the past four years.

| CHINA TRADE IN GOODS (NSA MIL $) | Jan 05 | Dec 06 | Jan 06 | M/M % | Y/Y % | 2006 | 2005 | 2004 |
|---|---|---|---|---|---|---|---|---|
| Exports | 86,620 | 94,094 | 64,989 | -7.94 | 33.25 | 969,323 | 769,377 | 593,646 |
| Imports | 70,740 | 73,097 | 55,500 | -3.22 | 27.46 | 791,797 | 660,222 | 560,813 |
| Balance | 15,880 | 20,997 | 9,489 | -5,117* | 6,391* | 177,529 | 102,105 | 32,837 |
| Exports to EU | 18,025 | 18,008 | 12,763 | 0.09 | 41.22 | 181,929 | 143,752 | 104,574 |
| Imports from EU | 8,432 | 8,161 | 6,092 | 3.34 | 38.41 | 90,352 | 73,549 | 69,179 |
| Balance | 9,593 | 9,848 | 6,671 | -259* | 2,921* | 91,575 | 70,203 | 35,395 |
| Exports to ASEAN | 6,448 | 7,185 | 4,820 | -10.26 | 33.78 | 71,324 | 53,459 | 49,203 |
| Imports from ASEAN | 8,008 | 8,498 | 6,435 | -5.77 | 24.44 | 89,538 | 75,017 | 62,955 |
| Balance | -1,560 | -1.313 | -1,615 | -246.56* | 55.42* | -18,213 | -19,5558 | -20,052 |


