 Global| Oct 13 2008
China's Trade Balance and theChanging Pattern of Trade
Summary
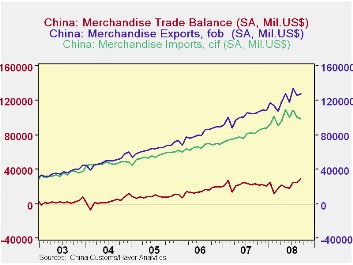
China chalked up another monthly record surplus on its trade in goods in September, rising $3.8 billion to $28.8 billion. Exports increased by $1.8 billion and imports declined by $2.0 billion, as shown in the first chart. So far this [...]

China chalked up another monthly record surplus on its trade in goods in September, rising $3.8 billion to $28.8 billion. Exports increased by $1.8 billion and imports declined by $2.0 billion, as shown in the first chart. So far this year, the surplus on trade is almost 4% below the comparable period of last year.
Not only has the surplus shown some moderate signs of diminishing this year, but there continue to be changes in the pattern of trade. Trade by country is not yet available for September, but the January through August data for this year show that exports to North America, largely the U. S., have increased over the comparable period of last year by the lowest percentage among the broad areas of the world. Exports to North America were up 10.5%; those to Asia, Oceania and Europe were up 20 to 30% and those to Africa and Latin America were up over 40% as can be seen in the table below.
Not only are the increases in China's exports to North America lower than those in other areas of the world, China's imports from North America show the smallest increase, 22.3%, compared with 25.6% from Asia and the Middle East and 29.4% from Europe. Imports from Africa, Latin America and Oceania were up 83.5%, 50.9% and 48.1% respectively.
| CHINA TRADE (Jan-Aug, bil. US$) | Exports | Imports | Balance | ||||||
|---|---|---|---|---|---|---|---|---|---|
| 2008 | 2007 | % Chg | 2008 | 2007 | % Chg | 2008 | 2007 | Chg % | |
| Asia and Middle East | 788.3 | 357.8 | 22.4 | 488.8 | 389.3 | 25.6 | -50.7 | -31.5 | -19.2 |
| Africa | 32.8 | 23.4 | 40.2 | 41.1 | 22.4 | 83.5 | -8.3 | 1.0 | -9.3 |
| Europe | 225.2 | 178.9 | 25.9 | 115.4 | 89.2 | 29.4 | 109.8 | 89.7 | 20.1 |
| Latin America | 46.7 | 31.6 | 47.8 | 48.9 | 32.4 | 50.9 | -2.2 | -0.8 | -1.4 |
| North America | 178.3 | 161.3 | 10.5 | 64.2 | 52.5 | 22.3 | 114.1 | 108.8 | 5.3 |
| Oceania | 16.5 | 12.7 | 29.9 | 27.1 | 18.3 | 48.1 | -10.6 | -5.6 | -5.0 |
| Total | 937.6 | 765.7 | 22.5 | 785.5 | 604.1 | 30.0 | 152.1 | 161.6 | -9.5 |
by Robert Brusca October 13. 2008

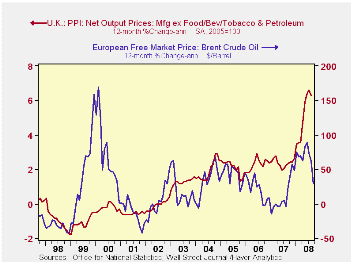
UK headline inflation turned lower for the second month running. Over three months headline PPI inflation is lower at a 1.7% annual rate. It is still up by 8.6% Yr./Yr. The lagged core rate was up at a 2.9% rate over three-months in August. That compared to +6.3% Yr/Yr. So the short horizon movement in inflation is more agreeable. Yet the history of inflation is entrenched with a rate that is too high permit any complacency over the trajectory of current rates. Still the three month result is encouraging and so are the last few months of the headline rate.
| UK PPI | |||||||
|---|---|---|---|---|---|---|---|
| %m/m | %-SAAR | ||||||
| Sep-08 | Aug-08 | Jul-08 | 3-mo | 6-mo | 12-mo | 12-moY-Ago | |
| MFG | -0.2% | -0.5% | 0.3% | -1.7% | 7.2% | 8.6% | 2.6% |
| Core | #N/A | -0.1% | 0.4% | #N/A | #N/A | #N/A | 2.3% |
| Lagged Core | 2.9% | 7.2% | 6.3% | 2.2% | |||
| Core: ex food beverages, tobacco & Petroleum | |||||||
More Economy in Brief
 Global| Feb 05 2026
Charts of the Week: Balanced Policy, Resilient Data and AI Narratives
by:Andrew Cates


