 Global| Jan 31 2012
China's Trade Surplus Continues Its Slow Decline
Summary
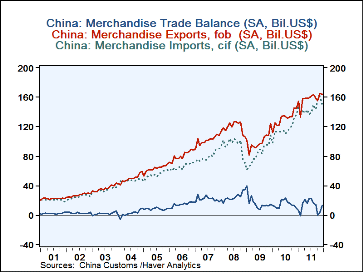
China's trade balance declined by $29,544 million from $177,819 in 2010 to $148.275 in 2011. The trend in the trade surplus has been slightly downwards since global trade recovered after the financial crisis of 2008. Imports into [...]
China's trade balance declined by $29,544 million from $177,819 in 2010 to $148.275 in 2011. The trend in the trade surplus has been slightly downwards since global trade recovered after the financial crisis of 2008. Imports into China seem to have risen somewhat faster than exports from China, reducing the rising trend of the trade balance. In fact there were two months in which imports exceeded imports resulting in trade deficits, $1,429 million in February and $417 million in October. The trade deficits were the first deficits since January, 2004, as can be seen on the first chart. (The chart is plotted on a log scale so that percentage changes rather than arithmetic changes are equal throughout the chart.)
More than half of China's trade is with Asia and the Middle East where China typically runs a trade deficit. In 2010, the latest year for which full calendar data are available, the deficit with Asia and the Middle East was $101,988 million. There were also deficits in 2010 of $32,200 million with Oceania and $6,901 with Africa. China's trade with Latin America resulted in a relatively small surplus of $758 million.
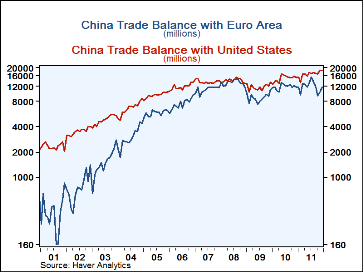
The two remaining areas, Europe and North America, accounted for about 34% of China's trade in 2010. At that time, China had trade surpluses of $137,361 million with Europe and $188,926 million with North America. While data are available only through November 2011 for Europe and North America, data for the Euro Area and the United States are available for the whole year. (These are shown in the second chart.) Until the financial crisis of the late '80sChina's trade balance with the Euro Area grew faster than that of the United States. Since then the two surpluses have remained relatively steady, as can be seen in the second chart. In December, 2011, China's trade surplus with the U.S$18,626 million and that with the Euro Area, $11,769 million
| Total Trade in Goods Mil US$) | Dec 11 |
Nov 11 |
Dec 10 |
M/M Chg |
Y/Y Chg |
2011 | 2010 | 2009 |
|---|---|---|---|---|---|---|---|---|
| Exports | 163865 | 165386 | 145043 | -1511 | 188812 | 1890164 | 1573195 | 1196588 |
| Imports | 150332 | 161535 | 135748 | -11203 | 14584 | 1749889 | 1395376 | 1001506 |
| Balance | 13533 | 3863 | 9305 | 9670 | 4228 | 148275 | 177819 | 195882 |
| 2010 Data | Trade Balance | Total Trade | Distribution | |||||
| Asia & Middle East | 101988 | 1566694 | 52.73% | |||||
| Africa | -6901 | 126891 | 4.27 | |||||
| Europe | 137361 | 573281 | 19.30 | |||||
| Latin America | 758 | 182870 | 6.16 | |||||
| North America | 188926 | 422940 | 14.24 | |||||
| Oceania | -32200 | 98260 | 3.31 | |||||


