 Global| Jul 10 2007
China's Trade Surplus Continues to Climb
Summary
China's trade surplus was a record $26.9 billion in June, an increase of $9.5 billion from May and $12.4 billion from June, 2006. For the first half of this year the surplus was $112.7 billion almost twice the size of the surplus in [...]

China's trade surplus was a record $26.9 billion in June, an increase of $9.5 billion from May and $12.4 billion from June, 2006. For the first half of this year the surplus was $112.7 billion almost twice the size of the surplus in the first half of 2006--$61.0 billion.
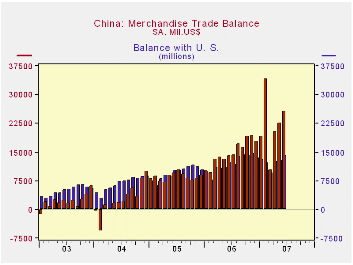
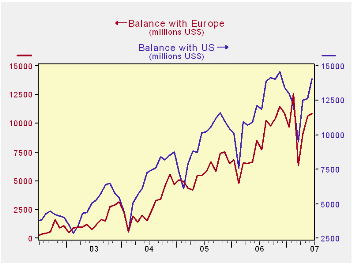
The June balance with the United States was $14.1 billion, or 52% of the total. In relative terms, the balance with the United States has declined over the years. In much of 2003-2005, the trade surplus with the U.S. exceeded that of the total trade balance as can be seen in the first chart. Since then China's increasing surplus on trade with Europe has muted the relative importance of the U.S. surplus. The second chart show the growing trade surpluses with the U.S. and Europe.
Nevertheless, it is the magnitude of the absolute value of the surplus with the U.S. that is the cause of increasing acrimony over trade policy between the two countries. Recently, added to the calls for more rapid yuan appreciation, there have been complaints regarding tainted or defective products such as fish, tooth paste and tires. These products, however, do not loom large in total exports. While data on tires are not available separately, they would amount to considerably less than the $961.3 million of Auto Parts and Accessories for May. Live and frozen fish exports amounted to $282.2 million in May and preparations for oral hygiene, $10.6 million out of total exports of $94.6 billion.
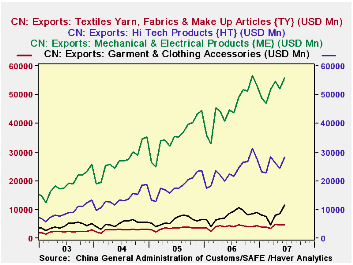
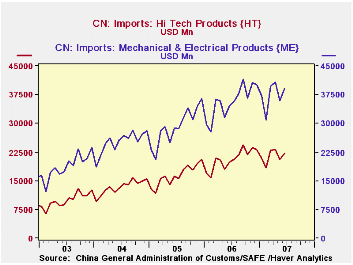
Of the $103.2 billion exports in June, the major exports were Textiles, Yarns and Fabrics, which were $4.7 billion; Garments and Clothing Accessories ($11.6 billion); Hi-Tech Products ($28.1 billion) and Mechanical and Electrical Products ($55.8 billion). These are shown in the third chart. Of the $76.0 imports in June, the two largest categories were Hi-Tech Products ($22.2 billion) and Mechanical and Electrical Products ($39.1 billion) as seen in the fourth chart. The fact that these last two categories figure in both imports and exports suggests that assembly plays a large part in China's manufacturing sector.Note: Haver has two China data bases: CHINA--CEIC Premium China Data Base and China in EMERGEPR. The CHINA data base is the more comprehensive, containing not only much of the data in EMERGEPR, but a wealth of other data. In addition to seasonally adjusted data in the CHINA database, some of the China data in EMERGEPR has been adjusted, by Haver, for the yearly variation in the Chinese New Year as well. Sometimes, there are minor differences in updating the series. For example, the China data on trade by country in EMERGEPR are today available for June while the latest data in CHINA are for May.
| CHINA TRADE (BIL $) | Jun 07 | May 07 | Apr 07 | Mar 07 | Feb 07 | Jan 07 | 2006 | 2005 | 2004 |
|---|---|---|---|---|---|---|---|---|---|
| Exports | 103.2 | 94.1 | 97.5 | 83.4 | 82.1 | 86.6 | 969.3 | 762.3 | 593.6 |
| Imports | 76.4 | 71.6 | 80.6 | 76.6 | 58.3 | 70.7 | 791.8 | 660.2 | 590.8 |
| Balance | 26.9 | 22.5 | 16.8 | 6.9 | 23.8 | 15.9 | 177.5 | 102.1 | 32.8 |
| Balance with US | 14.1 | 12.6 | 12.5 | 9.5 | 12.2 | 13.0 | 144.3 | 114.2 | 80.3 |
| Balance with Europe | 10.9 | 10.6 | 9.1 | 6.3 | 12.6 | 9.7 | 100.4 | 69.3 | 33.6 |
| Major Commodity Exports | |||||||||
| Textiles, Yarn, Fabrics etc | 4.6 | 4.7 | 4.9 | 3.3 | 3.8 | 4.0 | 48.8 | 41.1 | 33.5 |
| Garments & Clothing Accessories | 11.6 | 8.5 | 8.0 | 4.7 | 7.4 | 8.1 | 95.2 | 73.9 | 61.6 |
| Hi Tech Products | 28.1 | 24.3 | 26.2 | 28.5 | 22.9 | 23.0 | 281.6 | 218.4 | 165.6 |
| Mechanical & Electrical Products | 55.8 | 52.1 | 54.7 | 51.7 | 46.8 | 48.8 | 549.6 | 427.0 | 323.7 |
| Major Commodity Imports | |||||||||
| Mechanical & Electrical Products | 39.1 | 35.89 | 10.7 | 39.7 | 30.8 | 37.1 | 428.1 | 350.4 | 301.6 |
| Hi Tech Products | 22.2 | 20.5 | 23.2 | 23.0 | 18.4 | 20.7 | 247.4 | 197.7 | 161.3 |
More Economy in Brief
 Global| Feb 05 2026
Charts of the Week: Balanced Policy, Resilient Data and AI Narratives
by:Andrew Cates


