 Global| Sep 11 2007
China Wraps up a near Record Total Trade Surplus and Record Surpluses with the U.S. and Europe
Summary
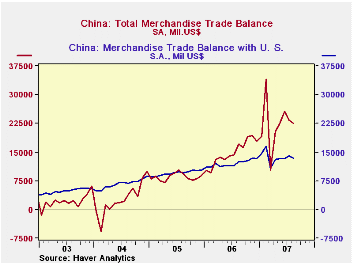
China's trade surplus rose to $24,974 million in August. the second highest on record. The trade surplus with the United States was $15,003 million and that was an all time high. The total surplus and that with the U.S. are shown in [...]

China's trade surplus rose to $24,974 million in August. the second highest on record. The trade surplus with the United States was $15,003 million and that was an all time high. The total surplus and that with the U.S. are shown in the first chart. (These are the data that are quoted in the press. They are not seasonally adjusted. Haver adjusts the data for seasonality and the occurrence of the Chinese New Year for China in the EMERGEPR data base. The adjusted data are shown in the second chart.)
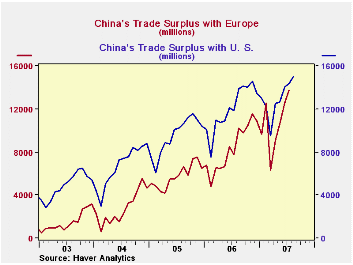
While the unrelenting increases in the surplus with the United States are causing increased tension between the two countries, it should be noted that the gap between the total surplus and that with the US is widening, indicating that surpluses with some other countries are increasing faster than that with the U. S. In August, China's surplus with Europe, for example, was at an all time high of $12,744 million and it has been rising faster that that of the U. S., as can be seen in the third chart.
Much of the China trade data can be found in either of the CHINA or the EMERGEPR data bases. In some cases one may be more up to date than the other or one might have more detail. For example, August data for the trade balance with Europe are available in the EMERGEPR data base but not in the CHINA data base. Although not so up to date as EMERGEPR in this instance, CHINA has far more country detail than the former.
| CHINA: TRADE IN GOODS | Aug 07 | Jul 07 | Jun 07 | May 07 | Apr 07 | 2006 | 2005 | 2004 |
|---|---|---|---|---|---|---|---|---|
| Total Trade Balance (Bil US$) | 25.0 | 24.4 | 26.9 | 22.4 | 16.8 | 177.5 | 102.0 | 32.1 |
| Balance with the U. S. (Bil US$) | 15.0 | 14.4 | 14.1 | 12.6 | 12.5 | 144.3 | 114.2 | 80.3 |
| Year over year Percent Change | 8.0 | 21.1 | 16.2 | 16.0 | 16.7 | 26.4 | 42.2 | 37.0 |
| Balance with Europe (Bil US$) | 12.8 | 12.2 | 12.5 | 10.6 | 9.1 | 100.4 | 69.3 | 33.6 |
| Year over year Percent Change | 24.6 | 77.0 | 46.9 | 59.6 | 77.0 | 45.0 | 105.9 | 82.9 |


