 Global| Nov 24 2008
Comparing Current Trends with Those in the Great Depression
Summary
Haver Analytics has a number of series that may prove useful in comparing and contrasting current conditions with those in the Great Depression.Among them are the annual series of real and nominal gross domestic product, its [...]
 Haver Analytics has a number of series that may prove useful
in comparing and contrasting current conditions with those in the Great
Depression.Among them are the annual series of real and nominal gross
domestic product, its components and prices in USNA
that go back to 1929.
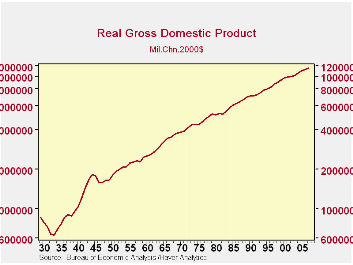
The first chart shows real GDP since 1929, plotted on a log scale to show equal percentage changes. Real GDP declined 26.5% from 1929 to 1933.
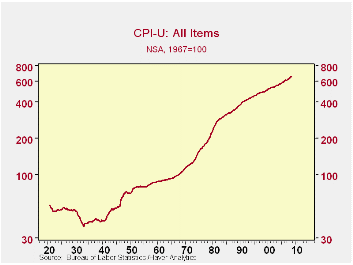
Monthly data on the Consumer Price Index are available from January 1921 and are shown in the second chart. Consumer prices declined steadily from 51.9 (1967=100) in May 1929 to 39.4 in December 1933, a decline of 24.1%. These data are found in the Prices section of USECON.
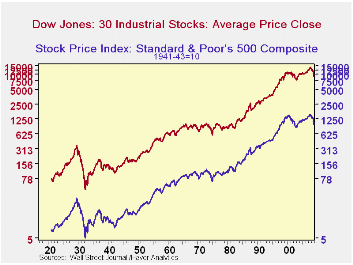
Long term monthly data are also available for stock prices and
interest rates. The third chart show monthly average prices for the Dow
Jones Industrial Average and for the S&P 500 Index.  The Dow
Jones declined 87.3% from 364.93 in September, 1929 to 46.19 in July,
1932. The S&P 500 declined 84.8% from 31.30 in September 1929
to 4.77 in June, 1933.
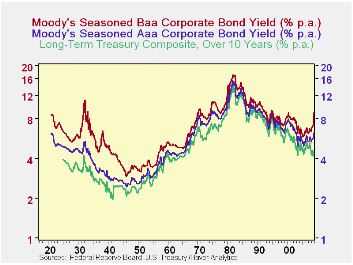
The fourth chart shows the interest rate on the Treasury's
long term composite (over ten years) together with the interest rates
on Moody's AAA and BBB corporate bonds.The rate on the Treasury goes
back to January, 1925 and the rates on Moody's corporates go back to
January 1921. Both the stock market data and interest rates are found
in the Financial Section of USECON.


More Economy in Brief
 Global| Feb 05 2026
Charts of the Week: Balanced Policy, Resilient Data and AI Narratives
by:Andrew Cates


