 Global| Mar 24 2009
Confidence Among French Manufacturers Stays at Record Low Levels
Summary
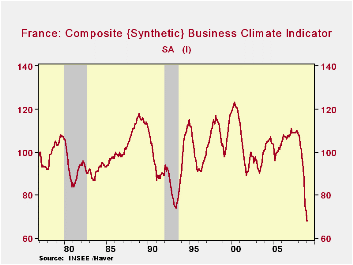
Confidence among French manufacturers in March remained at the all time low of 68 recorded in February, as can be seen in the first chart that shows the historical record of the series. (INSEE, the National Institute of Statistics and [...]

Confidence among French manufacturers in March remained at the all time low of 68 recorded in February, as can be seen in the first chart that shows the historical record of the series.
(INSEE, the National Institute of Statistics and Economics of
France, computes a synthetic indexes to measure confidence in overall
business, based on composite synthetic indexes for industry,
construction. services and retail and wholesale trade. The indexes are
so constructed that they have an average of 100 and a standard
deviation of 10. They are based on the replies of the respondents to a
survey regarding their recent output, orders, inventories and opinions
about the future of production and prices for their own business and
business in general. These replies are recorded in percent balances,
the difference between the percent expecting increases and the percent
expecting decreases.)
Given that the index was unchanged from February to March,
there were only very small, offsetting changes in the percent balances
of the items that make up the index, as can be seen in the table below.
The largest change was the 6 point improvement in the outlook for
production in general business, from -76% to -70%. The respondents were
also more positive on production in their own business and reported a
one point decline in inventories, which in view of the low demand, is a
positive. The rest of the components showed more negative balances. The
negative percent balance on recent changes in output, increased from
-49% in February to -51% in March, that for total order books went from
-67% to -69%, and for export order books, from -72% to -73%. To put the
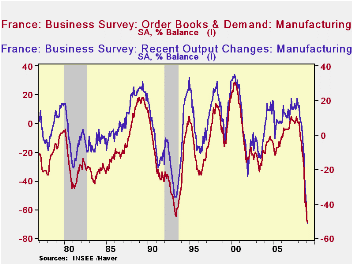
current percent balances in perspective, the second chart shows the
historical record of the percent balances for two of the components of
the overall index--the recent changes in output and total order books
and demand.
| FRANCE | Mar 09 | Feb 09 | Mar 08 | M/M CHG | Y/Y CHG | 2008 | 2007 |
|---|---|---|---|---|---|---|---|
| Composite Business Climate Indicator (Synthetic) | 68 | 70 | 109 | -2 | -40 | 97 | 109 |
| Manufacturing Climate Indicator (Synthetic) | 68 | 68 | 108 | 0 | -40 | -97 | 111 |
| Recent Changes in Output (%) | -51 | -49 | 17 | -2 | -67 | 0 | 16 |
| Inventory Levels (%) | 23 | 24 | 11 | -1 | +12 | 18 | 00 |
| Total Order Books and Demand (%) | -69 | -67 | 1 | -2 | -70 | -19 | 2 |
| Export Order Books (%) | -73 | -72 | 1 | -1 | -74 | -17 | 6 |
| Personal Outlook on Production (%) | -45 | -46 | 15 | 1 | -60 | -4 | 15 |
| General Outlook on Production(%) | -70 | -76 | -5 | 6 | -76 | -31 | 8 |
| Personal Outlook on Prices (%) | -15 | -14 | 9 | -1 | -24 | 9 | 6 |
| General Outlook on Prices (%) | -35 | -33 | 49 | -2 | -84 | 30 | 27 |
More Economy in Brief
 Global| Feb 05 2026
Charts of the Week: Balanced Policy, Resilient Data and AI Narratives
by:Andrew Cates


