 Global| May 24 2010
Confidence Improves In Slovenia, One Of The Smaller Euro Area Countries
Summary
The financial turmoil in the Euro Area has resulted in a sharp drop in confidence in the Euro Area, as a whole. The ZEW Indicator of Expectations for the entire Euro Area, released last week, fell from a balance of optimists of 46.0% [...]


The financial turmoil in the Euro Area has resulted in a sharp drop in confidence in the Euro Area, as a whole. The ZEW Indicator of Expectations for the entire Euro Area, released last week, fell from a balance of optimists of 46.0% in April to 37.6% in May. Today, however, Slovenia, one of the smaller nations and one of the more recent members of the euro area. reported today an increase in confidence. (Slovenia has a population of about 2 million and entered the Euro Area on January 1, 2007) The Statistical Office of Slovenia publishes an overall sentiment indicator, which is based on three separate indicators: consumer confidence, confidence in retail trade and in manufacturing. The indicators are in the form of percent balances.
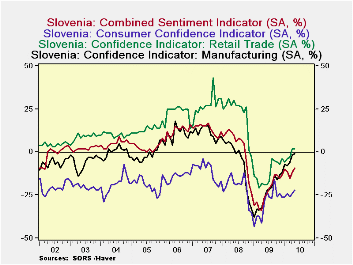
Although the overall indicator still shows an excess of pessimists, the excess of pessimists declined in May to 9 from 12. This is the best balance since October of 2008. Business personnel in Slovenia appear to be more positive than the consumer. In Retail trade, there is actually a small excess-2%-of optimists over pessimists and in Manufacturing, the pessimists outweigh the optimists by only 1%. There are, however, many more pessimists among the consumers. They exceeded the optimists by 22% in May, but this was an improvement over April's excess of pessimist of 24%. The percent balance of the four indicators are shown in the first chart.
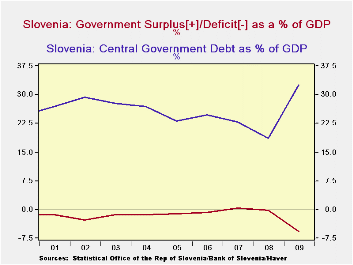
The improvement in confidence in May in Slovenia, in contrast to a decline for the Euro Area as a whole, may be due in part to Slovenia's relatively favorable financial situation. Although its government deficit as a percentage of GDP increased in 2009, part of the increase reflects the decline in GDP and may improve as the economy recovers. The level of debt to GDP is well below any danger point These ratios are shown in the second chart.
| SLOVENIA | May 10 | Apr 10 | Mar 10 | Feb 10 | Jan 10 | Dec 09 | Nov 09 | Oct 09 |
|---|---|---|---|---|---|---|---|---|
| Combined Sentiment Indicator (% Bal) | -9 | -12 | -15 | -11 | -10 | -13 | -15 | -13 |
| Consumer Confidence Indicator (% Bal) | -22 | -24 | -26 | -24 | -26 | -26 | -24 | -21 |
| Retail Confidence Indicator (% Bal) | 2 | 2 | -3 | -4 | -6 | -4 | -7 | -6 |
| Manufacturing Confidence Indicator (%Bal) | -1 | -2 | -6 | -8 | -7 | -12 | -13 | -16 |
More Economy in Brief
 Global| Feb 05 2026
Charts of the Week: Balanced Policy, Resilient Data and AI Narratives
by:Andrew Cates


