 Global| Jun 30 2008
Consumer Confidence in the U.K. Close to All Time Low
Summary
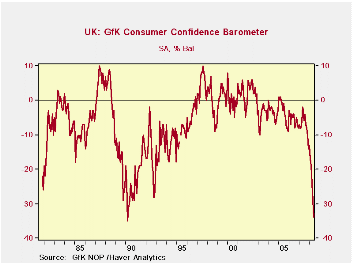
Consumer confidence in the U. K. has declined by 5 percentage points in each of the last three months and is now -34%, one point short of the lowest value recorded in March, 1990 as shown in the first chart. Consumer confidence in the [...]

Consumer confidence in the U. K. has declined by 5 percentage points in each of the last three months and is now -34%, one point short of the lowest value recorded in March, 1990 as shown in the first chart. Consumer confidence in the U. K. is measured by the market research firm, GfK NOP. The measure is the percent balance between those who view current economic and financial conditions and prospects positively and those who view them negatively.
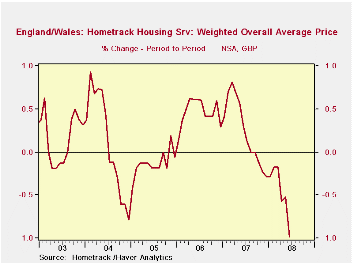
The decline in consumer confidence is no surprise. Consumers in the U.K., like those in many other countries, have been buffeted by rising inflation, slowing growth in jobs, declining house prices, foreclosures, and so on. There does not appear to be much, if any, relief in sight. The Hometrack Housing Survey, also released today, showed that house prices declined another 1% in June. They are now 5,800 GBP lower than in September 2007, as can be seen in the second chart.The Hometrack house price is mix adjusted, that is, the relative weight given to each characteristic of the house remains the same from one period to another. It is an attempt to measure the change in the price of a specific house from one period to the next. It is notthe change in average price of all houses sold.
| UNITED KINGDOM | Jun 08 | May 08 | Apr 08 | Mar 08 | Feb 08 | 2007 | 2006 | 2005 |
|---|---|---|---|---|---|---|---|---|
| GfK NOP Consumer Confidence (% balance) | -34 | -29 | -24 | -19 | -17 | -7 | -6 | -3 |
| Hometrack Weighted Average Price (GBP) | 170,500 | 172,200 | 173,100 | 174,100 | 174,400* | 174,867 | 165,725 | 161,592 |
| Hometrack Housing Price (M/M % change) | -0.99 | -0.52 | -0.57 | -0.17 | -0.17 | 5.52 | 2.56 | -2.38 |
| *Recent Peak 176,300 September 2007 | ||||||||


