 Global| Jun 28 2005
Consumer Confidence Rose Again
by:Tom Moeller
|in:Economy in Brief
Summary
The Index of Consumer Confidence from the Conference Board rose another 2.6% in June to 105.8 following an upwardly revised gain in May. Consensus expectations had been for a lesser increase to 104.1. During the last twenty years [...]
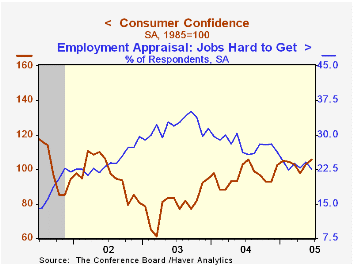
The Index of Consumer Confidence from the Conference Board rose another 2.6% in June to 105.8 following an upwardly revised gain in May. Consensus expectations had been for a lesser increase to 104.1.
During the last twenty years there has been a 52% correlation between the level of consumer confidence and the y/y change in real consumer spending. The correlation rose to 66% during the last ten years.
Consumer expectations rose again for the second month to the highest level since February (-5.0% y/y). Expectations for business conditions and income rose.
The present situation index rose for the fifth month this year (+14.0% y/y). Jobs were viewed as hard to get by a net 22.6% of survey participants, near the lowest level in three years.
The Conference Board’s survey isconducted by a mailed questionnaire to 5,000 households and about 3,500 typically respond.
| Conference Board | June | May | Y/Y | 2004 | 2003 | 2002 |
|---|---|---|---|---|---|---|
| Consumer Confidence | 105.8 | 103.1 | 2.9% | 96.1 | 79.8 | 96.6 |
by Tom Moeller June 28, 2005
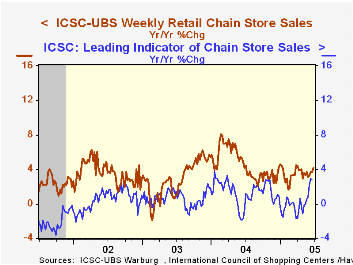
Chain store sales fell 0.6% last week following three consecutive weeks of gain according to the International Council of Shopping Centers (ICSC)-UBS survey. In June sales are 0.4% below the prior month's average.
During the last ten years there has been a 56% correlation between the y/y change in chain store sales and the change in non-auto retail sales less gasoline, as published by the US Census Department. Chain store sales correspond directly with roughly 14% of non-auto retail sales less gasoline.
The leading indicator of chain store sales from ICSC fell 0.2% w/w (+2.8% y/y) following two weeks of increase.
The ICSC-UBS retail chain-store sales index is constructed using the same-store sales (stores open for one year) reported by 78 stores of seven retailers: Dayton Hudson, Federated, Kmart, May, J.C. Penney, Sears and Wal-Mart.
| ICSC-UBS (SA, 1977=100) | 06/25/05 | 06/18/05 | Y/Y | 2004 | 2003 | 2002 |
|---|---|---|---|---|---|---|
| Total Weekly Chain Store Sales | 453.0 | 455.9 | 4.2% | 4.6% | 2.9% | 3.6% |
by Louise Curley June 28, 2005
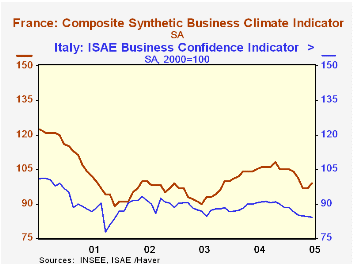
Business confidence in both France and Italy had remained unchanged or declined in the months since October, 2004 through May 2005. In June, however, business confidence in France rose, but confidence in Italy continued to weaken.The attached chart show the French and Italian measures of business confidence.
The composite business climate indicator for France rose 2.1% to 99 (100 being the long term average) in June. The rise has been attributed to the euro's recent decline against the dollar and to the 4.5 billion euro plan announced June 8 by Prime Minister Dominique de Villepin to increase employment.
The decline in the Euro failed to raise confidence in Italy but it may have been a factor in reducing the extent of the decline. The ISAE (Instituto de Studi e Analisis Economica) index of business confidence declined only 0.12% in June, in contrast to the 0.59% decline in May and 0.24% in April. The pessimism of Italian businessmen has no doubt been influenced by the fact that Italy has experienced two successive quarters of decline in real gross domestic product; -0.44% in the fourth quarter of 2004 and -0.51% in the first quarter of 2005. In France, on the other hand, GDP has increased of 0.67% and 0.21% in the corresponding periods.
As we have noted in previous commentaries on confidence, the recent rise in the price of oil has yet to be reflected in the confidence indicators.
| Jun 05 | May 05 | Jun 04 | M/M% | Y/Y% | 2004 | 2003 | 2002 | |
|---|---|---|---|---|---|---|---|---|
| France | ||||||||
| Composite Business Climate Indicator (Long Term Average = 100) | 99 | 97 | 105 | 2.06 | -5.71 | 105 | 95 | 97 |
| Italy | ||||||||
| ISAE Indicator of Business Confidence (2000 = 100) | 84.2 | 84.3 | 90.4 | -0.12 | -6.86 | 89.5 | 88.0 | 90.1 |

Tom Moeller
AuthorMore in Author Profile »Prior to joining Haver Analytics in 2000, Mr. Moeller worked as the Economist at Chancellor Capital Management from 1985 to 1999. There, he developed comprehensive economic forecasts and interpreted economic data for equity and fixed income portfolio managers. Also at Chancellor, Mr. Moeller worked as an equity analyst and was responsible for researching and rating companies in the economically sensitive automobile and housing industries for investment in Chancellor’s equity portfolio. Prior to joining Chancellor, Mr. Moeller was an Economist at Citibank from 1979 to 1984. He also analyzed pricing behavior in the metals industry for the Council on Wage and Price Stability in Washington, D.C. In 1999, Mr. Moeller received the award for most accurate forecast from the Forecasters' Club of New York. From 1990 to 1992 he was President of the New York Association for Business Economists. Mr. Moeller earned an M.B.A. in Finance from Fordham University, where he graduated in 1987. He holds a Bachelor of Arts in Economics from George Washington University.
More Economy in Brief

 Global| Feb 05 2026
Charts of the Week: Balanced Policy, Resilient Data and AI Narratives
by:Andrew Cates

