 Global| Feb 08 2005
December German Industrial Product--More Positive News for German Outlook
Summary
Industrial production in Germany rose 1.2% in December after a decline of 1.5% in November. In terms of end use categories, production of capital goods fell 2.83% from November to December, while production of consumer goods rose [...]

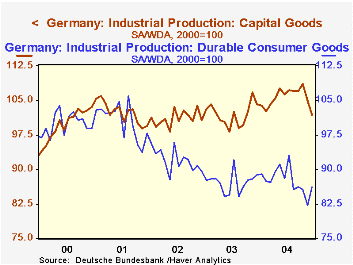
Industrial production in Germany rose 1.2% in December after a decline of 1.5% in November. In terms of end use categories, production of capital goods fell 2.83% from November to December, while production of consumer goods rose 2.43%--a 5.12% rise for durable consumer goods and a 1.95% rise for nondurables. Production of energy supplies rose 0.60% and production of intermediate goods, 3.38%.
For the year as a whole, production of intermediate goods showed the largest increase--5.42%, followed by production of capital goods at 3.56%. Production of consumer goods, both durable and nondurable, was up only about 0.5%, while energy production increased 1.62%.
Since the peaks reached in 2000 and 2001, production of consumer durable goods has suffered the greatest decline and in December was about 15% below the peak levels of those years. Production in most of the other end use categories are near or above their peak levels of production of the past five years. Production of consumer durable goods is contrasted with production of capital goods in the attached chart.
The December production data, particularly the sharp rise in durable consumer goods production, is one more factor in addition to the sharp rise in manufacturing orders reported earlier for December and the improvement in business and investor sentiment revealed by the IFO and ZEW measures of confidence in January that is beginning to generate a bit more positive outlook for the German economy.
| Industrial Production (2000=100) | Dec 04 | Nov 04 | Dec 03 | M/M % |
Y/Y % |
2004 % | 2003 % | 2002 % | 2001 % |
|---|---|---|---|---|---|---|---|---|---|
| Total | 101.0 | 99.8 | 100.1 | 1.20 | 0.90 | 2.33 | 0.08 | -1.21 | -0.38 |
| Intermediate goods | 106.9 | 103.4 | 101.4 | 3.38 | 5.42 | 4.12 | 0.65 | -0.48 | -0.60 |
| Capital goods | 101.9 | 104.9 | 104.2 | -2.86 | -2.21 | 3.56 | 0.82 | -1.26 | 2.57 |
| Consumer goods | 96.9 | 94.6 | 96.6 | 2.43 | 0.31 | 0.45 | -1.61 | -2.15 | -0.74 |
| Durables | 86.3 | 82.1 | 88.8 | 5.12 | -2.82 | 0.54 | -5.27 | -8.27 | 0.68 |
| Nondurables | 99.4 | 97.5 | 98.4 | 1.95 | 1.02 | 0.44 | -0.80 | -0.63 | -1.08 |
| Energy | 100.6 | 100.0 | 99.0 | -.60 | 1.62 | 1.38 | 2.45 | 0.11 | -2.57 |
More Economy in Brief
 Global| Feb 05 2026
Charts of the Week: Balanced Policy, Resilient Data and AI Narratives
by:Andrew Cates


