 Global| Nov 21 2005
Declines in the Euro and the Price of Oil Improve the Euro Zone Balance of Trade in Goods
Summary
The Euro Zone's surplus on trade in goods rose in September to 1,239.5 million euros from 190.0 million euros in August. This was only the third month this year in which a rise in the trade balance took place. For the nine months [...]

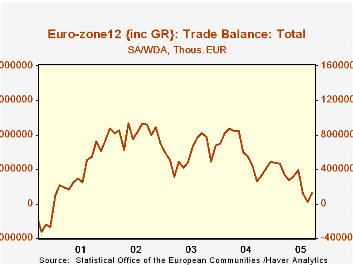
The Euro Zone's surplus on trade in goods rose in September to 1,239.5 million euros from 190.0 million euros in August. This was only the third month this year in which a rise in the trade balance took place. For the nine months through September, the trade surplus is 57% below the corresponding period of 2004. The deterioration in the trade surplus is shown in the first chart.
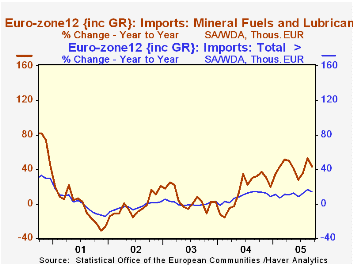
The main factors in the deterioration of the trade surplus have been the rise in the euro which tended to dampen export demand and the rise in the price of oil which increased imports. The second chart shows the year-to-year increases in total imports and imports of mineral fuels and lubricants. Since early 2004 the year-to-year increase in imports of mineral fuels and lubricants has ranged between 25 and 50%. 
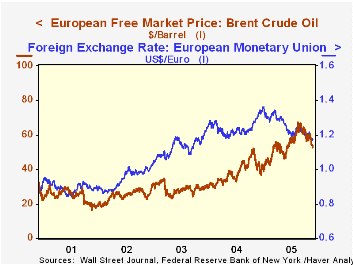
The euro has been declining for most of this year and the price of crude has recently eased suggesting that the outlook for the balance of trade in goods is improving. The Euro has declined about 14% from the peak reached on December 30, 2004.Just two months ago the Brent Crude oil was $64.49 a barrel. It is now 18% lower at $52.66. The dollar value of the euro and the price of Brent Crude oil are shown in the third chart on a daily basis.
| Euro Zone Trade in Goods (Millions of Euros) | Sep 05 | Aug 05 | Sep 04 | M/M % | Y/Y % | 2004 | 2003 | 2002 |
|---|---|---|---|---|---|---|---|---|
| Trade Balance | 1,239 | 190 | 2,673 | 1,049* | -1,434* | 71,827 | 70,027 | 99,097 |
| Exports | 107,019 | 106,672 | 95,492 | 0.33 | 12.07 | 1,144,937 | 1,059,880 | 1,083,611 |
| Imports | 105,779 | 106,482 | 92,818 | -0.66 | 13.96 | 1,073,110 | 989,853 | 984,514 |
| Mineral Fuels & Lubricants | 22,285 | 23,126 | 15,545 | -3.66 | 43.36 | 164,390 | 143,620 | 137,521 |
| Peak | Date | Current | Date | Pct Chg | ||||
| Euro ($) | 1.3623 | 12/30/04 | 1.1741 | 11/18/05 | -13.8 | |||
| Brent Crude Oil ($/bbl) | 64.49 | 9/21/05 | 52.66 | 11/18/05 | -18.3 | |||
| *Difference | ||||||||
More Economy in Brief
 Global| Feb 05 2026
Charts of the Week: Balanced Policy, Resilient Data and AI Narratives
by:Andrew Cates


