 Global| Jul 12 2005
Deflation Still a Problem in Japan
Summary
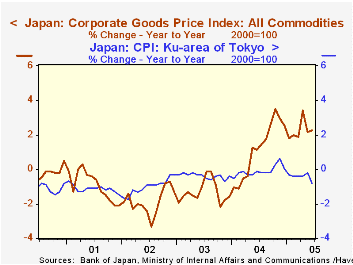
Signs that Japan's deflation may be ending remain equivocal. The Corporate Goods Price Index (CGPI) has been showing year to year increases since May, 2004. But corporations have been unable to pass these increases on to consumers. [...]

Signs that Japan's deflation may be ending remain equivocal. The Corporate Goods Price Index (CGPI) has been showing year to year increases since May, 2004. But corporations have been unable to pass these increases on to consumers. The first chart compares the year to year change in the CGPI and the Consumer Price Index. (Since the June CPI for all Japan is not yet available we have used the CPI for the Ku area of Tokyo, which, although lower than that for all Japan, has the same general trend.) This index declined in June and was almost 1% below June, 2004.
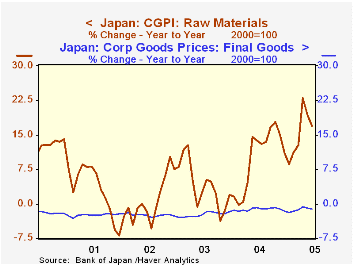
Another way of showing that so far, at least, corporations have been unable to pass on the higher cost of oil and other raw materials is shown in the second chart, which compares the indexes of raw material prices and of final goods prices. While the raw material price index in June was almost 17% above the level of June, 2004, the final goods index was 1% below its June, 2004 level.
Partly offsetting the rise in raw material costs has been the continued deflation among some final goods resulting from increased productivity. It is highly likely that increased productivity accounts for much of the decline in the index for the price of electric machinery and equipment, which was 70.5 in June, indicating a price decline of almost 30% since the year 2000. Other sophisticated goods such as transportation equipment and precision instruments that have been selling at levels below 2000 have also benefited from increase productivity.
| Japan Indexes 2000=100 |
Jun 05 | May 05 | Jun 04 | M/M% | Y/Y% | 2004 | 2003 | 2002 |
|---|---|---|---|---|---|---|---|---|
| Corporate Goods Price Index | 99.3 | 99.3 | 97.1 | 0.0 | 2.3 | 97.1 | 96.0 | 97.2 |
| Consumer Price Index: Ku-area of Tokyo |
96.8 | 97.3 | 97.6 | -0.51 | -0.82 | 97.4 | 97.5 | 97.9 |
| GCPI Raw Materials | 141.2 | 142.2 | 120.8 | -0.70 | 16.89 | 118.5 | 107.7 | 103.7 |
| Petrol and Coal | 149.6 | 151.2 | 127.4 | -1.06 | 17.43 | 127.4 | 116.3 | 109.3 |
| GCP1 Final Goods | 91.0 | 91.1 | 92.0 | -0.11 | -1.09 | 91.8 | 92.9 | 95.2 |
| Elec. Machinery & Eqpt | 70.5 | 70.6 | 74.6 | -0.14 | -5.50 | 74.1 | 78.7 | 86.2 |
| Transportation Equip | 97.3 | 97.4 | 98.3 | -0.10 | -1.02 | 98.3 | 99.5 | 100.1 |
| Precision Instruments | 97.1 | 97.0 | 98.2 | 0.10 | -1.12 | 98.1 | 100.5 | 102.5 |
More Economy in Brief
 Global| Feb 05 2026
Charts of the Week: Balanced Policy, Resilient Data and AI Narratives
by:Andrew Cates


