 Global| Feb 08 2011
Differences In Inflation: Chile; Latvia And Pakistan
Summary
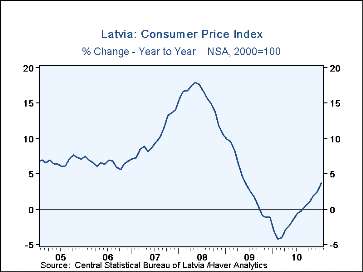
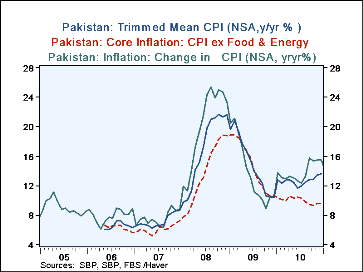
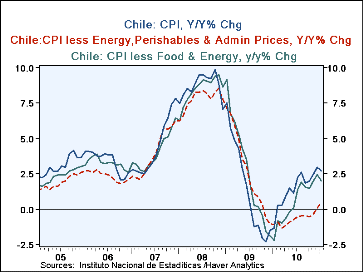
Chile, Latvia, and Pakistan reported their inflation rates for January today. The year to year change in the Consumer Price Index--the most common measure of inflation--was 2.73% for Chile, 3.66% for Latvia and 14.19% for Pakistan.The [...]
 Chile, Latvia, and Pakistan reported their inflation rates for January today. The year to year change in the Consumer
Price Index--the most common measure of inflation--was 2.73% for Chile, 3.66% for Latvia and 14.19% for Pakistan.The
releases of the three countries illustrate the various ways in which inflation can be reported. There is the year to year
change in the CPI which is available for practically every country. Almost as common is core inflation. Usually core inflation,
measures the year to year change in the Consumer Price Index excluding food and energy, but many countries have their own
definition of "core" inflation.
Somewhat less common are Median CPI and the Trimmed Mean CPI that the Federal Reserve Bank of Cleveland has popularized. The bank publishes these data for the United States, and some foreign institutions have started to publish similar data for their particular country. These measures are designed to reduce the impact of large but transitory prices change in any, not just food and energy, prices. One is called the weighted Median CPI and the other the Trimmed Mean CPI. The Median CPI, uses median prices rather than mean prices of the components of the index in the calculation of the total index. Use of the median, which is the mid point of a series, means that the influence of outliers is excluded
The Trimmed Mean CPI relies on means, but truncates the data on which the mean is calculated. The Federal Reserve Bank of Cleveland found that if they lopped 8% of the ends of the distribution of the price changes, a substantial amount of the volatility in the data was reduced. Their measure is the 16% Trimmed Mean CPI.
In today's releases, Latvia, released only the CPI and its year to year percent changes. which is shown in the first chart. Chile, in addition to publishing an over all index. publishes two core indexes, 1) CPI less food and energy and 2) CPI less energy, perishables and administered prices. Currently the CPI less food and energy is rising almost as fast as the total index, but the CPI less energy, perishables and administered prices has only been in positive territory in December and January. This index has, until very recently, highlighted an underlying tendency toward deflation. The three indexes are shown in the second chart
Pakistan computes the year to year changes in the total CPI, the CPI less food and energy, and a Trimmed Mean CPI. All three are shown in the third chart Pakistan's high rate of change in total CPI is apparently due largely to the increases in food and energy prices, but the Trimmed Mean CPI suggests that there are other factors than food that are affecting the total index. Although the data on weights are not available, food apparently is a large item in the Pakistan cost of living. As a result, as long as food prices remain high, inflation in Pakistan's is likely to remain high even thought the Trimmed Mean CPI suggests that there are deflationary forces 11here as well.
| Jan'11 | Dec'10 | Nov'10 | Oct'10 | Sep'10 | Aug'10 | Jul'10 | Jun'10 | |
|---|---|---|---|---|---|---|---|---|
| Latvia (y/y % Chg) | 3.66 | 2.52 | 191 | 1.01 | .-0.47 | -0.24 | -0.59 | -1.34 |
| Chile (y/y % Chg) | ||||||||
| CPI | 2.73 | 2.97 | 2.46 | 1.98 | 1.87 | 2.62 | 2.25 | 1.16 |
| CPI less food and energy | 2.01 | 2.46 | 1.96 | 1.48 | 1.54 | 1.90 | 1.41 | 0.06 |
| CPI less energy, perishables and administered prices | 0.49 | 0.07 | -0.37 | -0.52 | -0.48 | -1.49 | -0.54 | -0.76 |
| Pakistan (y/y % Chg) | ||||||||
| CPI | 14.19 | 15.46 | 15.48 | 16.33 | 15.71 | 13.23 | 12.34 | 12.69 |
| CPI less food and energy | 2.01 | 2.46 | 1.96 | 1.48 | 1.56 | 1.90 | 1.41 | 0.06 |
| CPI Trimmed Mean | 0.49 | 0.07 | -0.37 | -0.52 | -0.48 | -0.49 | -0.54 | -0.74 |
More Economy in Brief
 Global| Feb 05 2026
Charts of the Week: Balanced Policy, Resilient Data and AI Narratives
by:Andrew Cates


