 Global| Sep 29 2008
Economic Sentiment in the Euro Area Declines Again in September
Summary
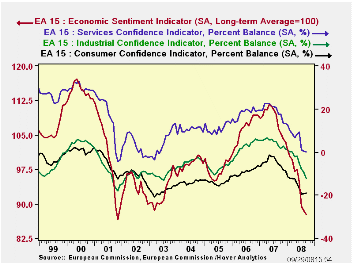
The Euro Area's Economic Sentiment Indicator fell another 0.8 points in September, continuing a virtually uninterrupted decline since May 2007. The index now stands at 87.7 compared to the long-term average of 100. The indicator, [...]

The Euro Area's Economic Sentiment Indicator fell another 0.8 points in September, continuing a virtually uninterrupted decline since May 2007. The index now stands at 87.7 compared to the long-term average of 100. The indicator, together with its three major components, Industrial, Consumer and Service Confidence measures, whose weights account for 90% of the indicator, are shown in the first chart. The components are measured in terms of percent balances.
Sentiment in the service sector has generally been more positive than that in the consumer and industrial sectors, but now even this indicator is barely positive at a balance of 0.2% in September. There was an insignificant increase of 0.3 points in September in the consumer indicator, which did little to reduce its short fall from last year. The indicator is still 17.3 points below September 2007. There was a substantial decline of 2.8 points in the Industrial confidence indicator in September. That indicator is now 14.7 points below September, 2007.
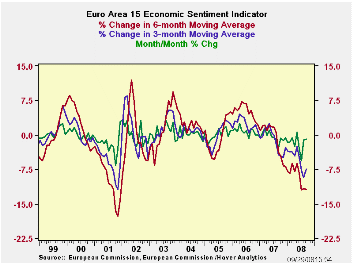
Because of the volatility in the monthly sentiment indicator it is not a particularly good predictor of short-term economic activity. Three or six month moving averages smooth out some of the volatility and are therefore somewhat better predictors of the trend of activity. The second chart compares the month to month change in the sentiment indicator with the month to month changes in the three and six months moving averages. The longer term averages are clearly pointing to lower activity.
| EURO AREA | Sep 08 | Aug 08 | Sep 07 | M/M % chg | Y/Y % chg | 2007 | 2006 | 2005 |
|---|---|---|---|---|---|---|---|---|
| Economic Sentiment Indicator (Long Term Average =100) | 87.7 | 88.5 | 103.4 | -0.90 | -17.50 | 108.4 | 106.3 | 97.4 |
| Industrial Confidence (% balance) | -12.1 | -9.3 | 2.6 | -2.8 | -14.7 | 4.4 | 2.2 | -7.2 |
| Consumer Confidence | -18.9 | -19.2 | -5.7 | 0.3 | -13.2 | -4.9 | -9.1 | -13.9 |
| Service Confidence | 0.2 | 0.6 | 13.6 | -0.4 | -17.3 | 19.3 | 18.0 | 11.1 |
More Economy in Brief
 Global| Feb 05 2026
Charts of the Week: Balanced Policy, Resilient Data and AI Narratives
by:Andrew Cates


