 Global| Aug 17 2009
Empire State Factory Conditions Improve To Highest Level in Two Years
by:Tom Moeller
|in:Economy in Brief
Summary
For August, the Federal Reserve Bank of New York reported that its Empire State Factory Index of General Business Conditions was positive and at its highest level in two years. The latest reading of 12.08 compares to sharply negative [...]
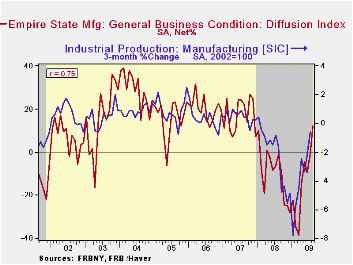
For August, the Federal Reserve Bank of New York reported that its Empire State Factory Index of General Business Conditions was positive and at its highest level in two years. The latest reading of 12.08 compares to sharply negative levels this past Winter and suggests positive growth in factory sector activity. The latest level was better than Consensus expectations for a reading of 3.0.
The figure is a diffusion index. Since the series' inception in 2001, there has been a 75% correlation between its level and the three-month change in U.S. factory sector industrial production. Like the Philadelphia Fed Index of General Business Conditions, the Empire State Business Conditions Index reflects answers to independent survey questions; it is not a weighted combination of the components. The series dates back only to 2001.
The Empire State Manufacturing Survey is a monthly survey of
manufacturers in New York State. Participants from across the state in
a variety of industries respond to a questionnaire and report the
change in indicators from the previous month. Respondents also state
the likely direction of these same indicators six months ahead.
For more on the Empire State Manufacturing Survey, including
methodologies and the latest report, click here.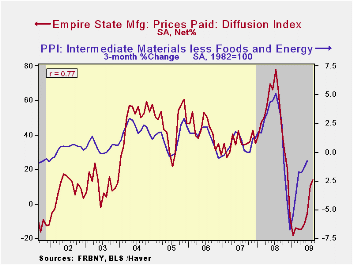
The new orders component paced the August index gain with a rise to the highest level in two years. The shipments index also improved to its highest since early-2008 while the employment index jumped m/m to its highest level since last October. In the history of the NY employment index, there has been an 87% correlation between the employment index and the three-month growth in overall U.S. factory sector employment as reported by the Labor Department. The workweek index also improved sharply as the unfilled orders, inventories and delivery times series rose modestly.
The price index firmed to its highest level since November. Nevertheless, the index level remained down sharply from last year. Since inception in 2001, there has been a 77% correlation between the index of prices paid and the three-month change in the core intermediate materials PPI.
The Empire State index of expected business conditions in six months rose during August to its highest level since early 2007. The subseries for new orders, shipments, employment and capital expenditures each ticked up.
The Empire State data is available in Haver's SURVEYS database.
Below the Line: Estimates of Negative Equity among Nonprime Mortgage Borrowers from the Federal Reserve Bank of New York can be found here.| Empire State Manufacturing Survey | August | July | August '08 | 2008 | 2007 | 2006 |
|---|---|---|---|---|---|---|
| General Business Conditions (diffusion index, %) | 12.08 | -0.55 | -1.16 | -10.10 | 17.23 | 20.24 |
| New Orders | 13.43 | 5.89 | -3.50 | -6.25 | 15.71 | 20.11 |
| Employment | -7.45 | -20.83 | -4.49 | -5.36 | 11.28 | 12.62 |
| Prices Paid | 13.83 | 10.42 | 65.17 | 46.99 | 35.64 | 41.88 |
by Tom Moeller August 17, 2009
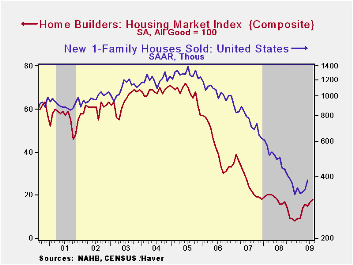
According to the National Association of Home Builders, the housing market continued its recent improvement during August. Their Composite Housing Market Index rose to 18 which equaled the highest level since June of last year, and it was up off the low of 8 this past January. The index is compiled from survey questions asking builders to rate market conditions as “good”, “fair”, “poor” or “very high” to “very low”. The figure is a diffusion index, therefore, numerical results over 50 indicate a predominance of “good” readings.
Also showing improvement during all of the first quarter was
the Home Builders' Housing Opportunity Index, which is the share of
homes sold that could be considered affordable to a family earning the
median income. It jumped to a record high of 72.5% buoyed by lower home
prices, lower interest rates and higher income. (There is a break in
the series from 2002 to 2003.)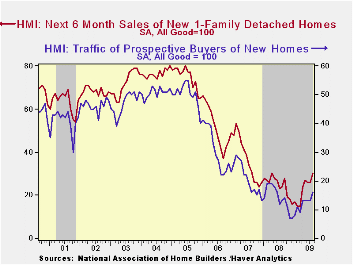
The Home Builders Association indicated that improvement in the August figures was due to a rise in the sub-index of sales during the next six months to the highest level since April '08. At a reading of 30 the figure was double the lows of this past winter. The present sales index was stable at 16.
The strength in the August composite index reading was led by strong improvement in the Northeast to the highest level since November 2007. In the West the index also posted a firm gain to the highest level since May of 2008. In the Midwest the index rose to its highest since June '08 and in the South the index slipped after having risen this past Spring.
The NAHB has compiled the Housing Market Index since 1985. The weights assigned to the individual index components are .5920 for single family detached sales, present time; .1358 for single family detached sales, next six months; and .2722 for traffic of prospective buyers. The results, along with other housing and remodeling indexes from NAHB Economics, are included in Haver’s SURVEYS database.
Strong Medicine for an Ailing Economy from the Federal Reserve Bank of Atlanta can be found here.
| Nat'l Association of Home Builders | August | July | August '08 | 2008 | 2007 | 2006 |
|---|---|---|---|---|---|---|
| Composite Housing Market Index (All Good = 100) | 18 | 17 | 16 | 16 | 27 | 42 |
| Single-Family Sales | 16 | 16 | 16 | 16 | 27 | 45 |
| Single-Family Sales: Next Six Months | 30 | 26 | 24 | 25 | 37 | 51 |
| Traffic of Prospective Buyers | 16 | 13 | 13 | 14 | 21 | 30 |
by Robert Brusca August 17, 2009
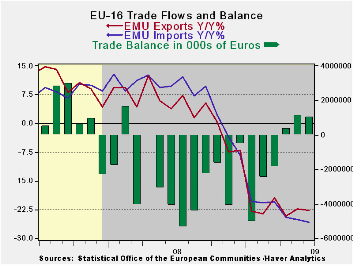
Exports have the better trend among bad results
EMU exports and imports are still on life support in terms of their
year-over-year drops. But exports are showing slightly more life in
recent months. Apart from splitting hairs, exports and imports were
roughly flat in June.
The end of the end but where is the new beginning?
Although there has been some pick up in orders for industrial goods,
exports themselves are not popping in Europe. Europe is getting ready
to exit recession based on the fact that the EMU’s GDP barely fell in
2009-Q2 as Germany and France posted positive GDP growth numbers.
Today, Japan posted an increase in its Q2 GDP so the list of countries
exiting recession is growing. Yet, some of those exiting recession do
not seem to have very good breadth or strength to the various key
economic sectors that need to drive and sustain a true recovery.
Technical recovery
The economies exiting recession are doing so rather narrowly on barely
positive GDP without much breadth or momentum to their turnaround
raising questions about the strength of recovery as well as about its
sustainability. The OECD leading indicators see a lot of momentum shift
in Europe, but not so much lift in Japan. Both Europe and Japan depend
a lot on trade for growth. The U is the sole country in this group of
four that has not yet posted positive GDP. But the US is, in contrast,
showing a lot of upward momentum as well as decreased downward
momentum; it has trimmed its deep negative growth rates across most
sectors and business cycle measures. US GDP only fell at a -1% annual
rate in 2009-Q2. It too, Like EMU, is on the brink of recovery.
Searching for Mr. Good -Growth
For Europe the end of recession is not being created by much if any
increase in consumer spending. Business fixed investment is still
chilled. And as we see here exports have the smallest of possible
upward gradients in train. While recessions have been deemed as
technically over in a number of countries I think we are still on the
outlook for a real recovery anywhere.
| E- Area 16-Trade trends for goods | ||||||
|---|---|---|---|---|---|---|
| M/M% | % Saar | |||||
| Jun-09 | May-09 | 3M | 6M | 12M | 12M Ago | |
| Balance* | €€ 1,042 | €€ 1,108 | €€ (2,399) | €€ (1,142) | €€ (481) | €€ 698 |
| Exports | ||||||
| All Exp | -0.1% | -1.8% | -10.3% | -24.8% | -22.8% | 3.9% |
| Food and Drinks | 0.0% | -2.0% | -7.6% | -16.6% | -9.9% | 10.9% |
| Raw materials | 0.4% | 2.2% | 16.0% | 8.8% | -21.2% | 7.7% |
| Other | -0.1% | -1.9% | -11.0% | -26.0% | -23.7% | 3.4% |
| MFG | -3.0% | -2.3% | -25.4% | -30.7% | -25.2% | 1.0% |
| IMPORTS | ||||||
| All IMP | 0.0% | -2.5% | -19.8% | -26.9% | -25.9% | 9.8% |
| Food and Drinks | -2.8% | -2.6% | -34.5% | -15.3% | -8.8% | 8.0% |
| Raw materials | -0.8% | -4.1% | -35.8% | -59.5% | -42.4% | 4.8% |
| Other | 0.2% | -2.5% | -17.7% | -25.7% | -26.0% | 10.1% |
| MFG | -2.5% | -1.7% | -29.8% | -29.1% | -23.2% | -0.2% |
| *Eur mlns; mo or period average | ||||||
by Louise Curley August 17, 2009
As generally expected, Japan's GDP rose in the second quarter,
but the 3.7% annual rate of increase was below the 4-4.5% consensus
estimate and failed to impress the financial markets. Japan's Nikkei
225 stock price index greeted the rise with a resounding drop of 3.10%,
its worst one day drop since March 30.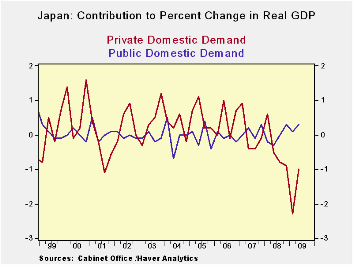
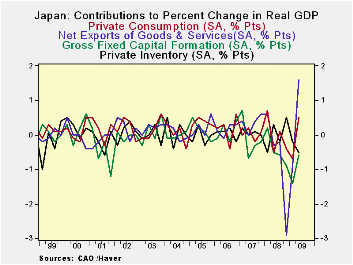
The quarter to quarter rise of 0.9% was accounted for by an increases in net exports of 1.6 percentage points and in private consumption of 0.5 percentage points. These positives were offset by a 0.6 point decline in gross fixed capital formation, a 0.5 point decline in private inventories and a 0.1 pt decline in government consumption. Except for the contribution of government consumption, the contributions of the four other activities are shown in the first chart.
In spite of government's stimulus programs, the rise in private consumption has not been large enough to offset the declines in business investment. As a result, domestic demand, especially private domestic demand, is still declining, casting doubts concerning the sustainability of the upturn. Private and public contributions to growth in domestic demand are shown in the second chart. Perhaps another concern is the GDP deflator. Although the year over year change is still positive, it was smaller than those of the previous two quarters. The specter of deflation still hovers over the outlook.
| Q2 09 | Q1 09 | Q4 08 | Q3 08 | Q2 08 | Q1 08 | |
|---|---|---|---|---|---|---|
| Contribution to Quarterly Changes in GDP (Percent Points) | 0.9 | -3.1 | -3.5 | -1.0 | -1.1 | 1.0 |
| Net Exports | 1.6 | -0.9 | -2.9 | -0.2 | -0.3 | 0.6 |
| Fixed Capital Formation | -0.6 | -1.4 | -0.9 | -0.6 | -0.5 | 0.2 |
| Change in Inventories | -0.5 | -0.2 | 0.5 | -0.2 | 0.3 | -0.5 |
| Private Consumption | 0.5 | -0.7 | -0.4 | -0.1 | -0.5 | 0.7 |
| Government Consumption | -0.1 | 0.0 | 0.3 | 0.0 | -0.1 | -0.1 |
| Contribution to Domestic Demand | -0.7 | -2.2 | -0.6 | -0.8 | -0.8 | 0.4 |
| Private Demand | -1.0 | -2.3 | -0.9 | -0.8 | -0.5 | 0.6 |
| Public Demand | 0.3 | 0.1 | 0.3 | 0.0 | -0.3 | -0.2 |
| Year over Year Change in GDP Deflator (%) | 0.54 | 0.89 | 0.75 | -1.55 | -1.39 | -1.32 |

Tom Moeller
AuthorMore in Author Profile »Prior to joining Haver Analytics in 2000, Mr. Moeller worked as the Economist at Chancellor Capital Management from 1985 to 1999. There, he developed comprehensive economic forecasts and interpreted economic data for equity and fixed income portfolio managers. Also at Chancellor, Mr. Moeller worked as an equity analyst and was responsible for researching and rating companies in the economically sensitive automobile and housing industries for investment in Chancellor’s equity portfolio. Prior to joining Chancellor, Mr. Moeller was an Economist at Citibank from 1979 to 1984. He also analyzed pricing behavior in the metals industry for the Council on Wage and Price Stability in Washington, D.C. In 1999, Mr. Moeller received the award for most accurate forecast from the Forecasters' Club of New York. From 1990 to 1992 he was President of the New York Association for Business Economists. Mr. Moeller earned an M.B.A. in Finance from Fordham University, where he graduated in 1987. He holds a Bachelor of Arts in Economics from George Washington University.
More Economy in Brief

 Global| Feb 05 2026
Charts of the Week: Balanced Policy, Resilient Data and AI Narratives
by:Andrew Cates

