 Global| Jun 01 2009
Encouraging News From UK's Hometrack Housing Survey
Summary
This May, the Hometrack Housing Survey, which processes information gathered by real estate agents in England and Wales, suggests that the decline in the property market may be reaching bottom. Three of the indicators that Hometrack [...]

This May, the Hometrack Housing Survey, which processes
information gathered by real estate agents in England and Wales,
suggests that the decline in the property market may be reaching
bottom. Three of the indicators that Hometrack monitors continued to
improved in May and one was unchanged. The average price of a house was
unchanged from April, the first break in the steady monthly declines
that began in October 2007. The price is now 155,600 pounds, 16,600
pounds below a year ago and 29,700 pounds below the peak of 176,300
reached in June, July and August of 2007. The last time one could buy a
house near the current price was September 2002 when the average price
was 154,500 pounds.
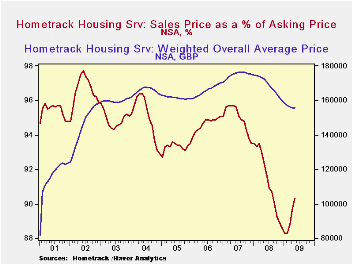
The difference between the selling price and the asking price has been narrowing since January and February of this year when the sale price was 88.3% the asking price. The May percentage was 90.3%, up from 89.6% in April. This percentage, however, is among the lower percentages recorded over the nine-year history of the data. The selling price was 97.7% of the selling price in January, 2002. The first chart shows the average price of a house and sales price and a percentage of the asking price since January 2001.
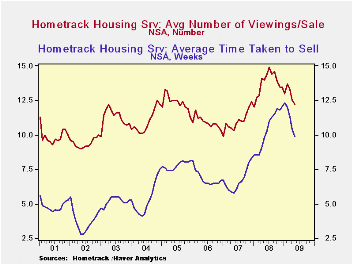
The average time it takes to sell a house has also been falling since January of this year when it took 12.3 weeks to complete a sale. In May it took 9.9 weeks. Again this is a relatively long time when viewed over the past nine years. From 2001 through 2007, the number of weeks it took to complete a sale varied from 2.8 in May and June of 2002 to 8.3 in December, 2007.
Finally, the number of viewings per sale has been slowly trending down since July 2008 when it reached 14.9. By May the number of viewings was 12.2, down from 12.5 in April. The second chart shows the average time taken to sell a house and the number of viewings per sale.
| UK Hometrack Housing Survey | May 09 | Apr 09 | May 08 | M/M Chg | Y/Y Chg | 2008 | 2007 | 2006 |
|---|---|---|---|---|---|---|---|---|
| House Price (000 GBP) | 155.6 | 155.6 | 172.2 | 0.0 | -16.6 | 168.7 | 174.4 | 165.7 |
| Sale Price/ Asking Price (%) | 90.3 | 89.6 | 92.3 | 0.7 | -2.0 | 91.3 | 96.0 | 94.7 |
| Average Time Taken to Sell (No. of Weeks) | 9.9 | 10.4 | 9.8 | -0.5 | 0.1 | 10.4 | 6.7 | 6.8 |
| Average Number of Viewings per Sale | 12.2 | 12.5 | 14.0 | -0.3 | -1.8 | 13.7 | 11.0 | 10.9 |
More Economy in Brief
 Global| Feb 05 2026
Charts of the Week: Balanced Policy, Resilient Data and AI Narratives
by:Andrew Cates


