 Global| Jan 02 2007
Encouraging Trends in Retail Sales in Hong Kong and Denmark
Summary
In Europe and the Pacific Rim, increases in consumer spending have lagged behind increases in investment spending and net exports. The news, today, from Hong Kong in the Far East and Denmark in Europe is encouraging. In volume terms [...]

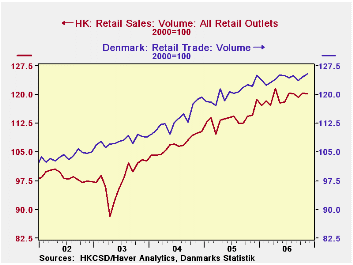
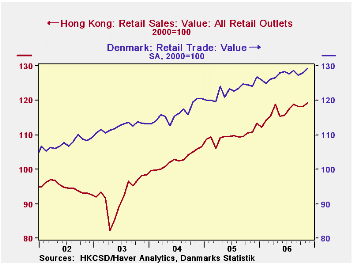
In Europe and the Pacific Rim, increases in consumer spending have lagged behind increases in investment spending and net exports. The news, today, from Hong Kong in the Far East and Denmark in Europe is encouraging. In volume terms retail sales in November in Hong Kong were slightly, 0.19%, below October but were 7.72% above November, 2005. In Denmark retail sales rose 0.72% in October and were 4.03% above November, 2005. For the eleven months of this year retail sales in Hong Kong are up 6.8% in value terms and 5.2% in volume. Comparable figures for Denmark are 3.9% and 3.4%. The first chart compares the trend in the volume of retail sales in Hong Kong and Denmark, while the second chart compares the trends in the value of retail sales.
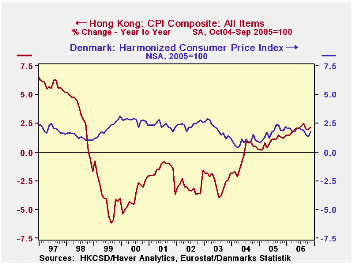
The greater difference between the value indexes and the volume indexes is the largely the result of the different price trends in Hong Kong and Denmark. From late 1998 until mid 2004, Hong Kong experienced deflation, while Denmark experienced annual prices increases of about 2.5%. (See the third chart.)
The city state of Hong Kong and the country of Denmark are too small to be used as projectors of trends in broader areas--the Pacific Rim and European Union, but the news today is at least affirmative. Hong Kong has a population of 7.0 million and Denmark one of 5.4 million. In Euro terms Gross Domestic Product in Denmark is currently 56 billion euros while that of Hong Kong is 37 billion Euros.
| RETAIL SALES | Nov 06 | Oct 06 | Nov 05 | M/M % | Y/Y % | 2005 | 2004 | 2003 | Jan-Nov06/ Jan-Nov05 |
|---|---|---|---|---|---|---|---|---|---|
| Hong Kong Value (2000=100) | 110.2 | 109.3 | 102.3 | 0.82 | 7.72 | 101.3 | 94.9 | 85.6 | 6.8 |
| Denmark Value (2000=100) | 129.2 | 128.0 | 124.2 | 0.94 | 4.03 | 122.9 | 116.4 | 112.3 | 3.9 |
| Hong Kong Volume (2000=100) | 107.2 | 107.4 | 102.2 | -0.19 | 4.89 | 101.5 | 95.4 | 87.5 | 5.2 |
| Denmark Volume (2000=100) | 125.5 | 124.6 | 122.2 | 0.72 | 2.70 | 120.5 | 113.6 | 107.9 | 3.4 |


