 Global| Aug 23 2010
Euro-Area : PMIs And Consumer Confidence
Summary
Today's news out of the Euro-Area continues to be relatively favorable. Although the Purchasing Mangers Survey of conditions in the Euro-Area showed small declines in the composite, manufacturing and service indexes, the indexes [...]
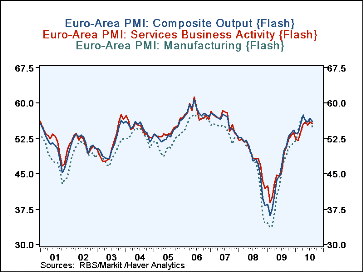
Today's news out of the Euro-Area continues to be relatively favorable. Although the Purchasing Mangers Survey of conditions in the Euro-Area showed small declines in the composite, manufacturing and service indexes, the indexes continue in the expansion zone. France's composite index declined slightly as the service index declined more than the manufacturing index improved. The opposite was reported for Germany where the composite index rose slightly as the increase in the service sector outweighed the decline in manufacturing index. The first chart shows the composite, manufacturing and service PMIs for the Euro-Area.
Some good news from the consumer sector. Since the beginning of this year, Eurostat has been publishing a preliminary or "Flash" estimate of its consumer confidence indicator about one week prior to the release of the actual indicator. The indicator is based on consumers' appraisals of their financial condition, the general economic situation, employment expectations and savings over the next twelve months.
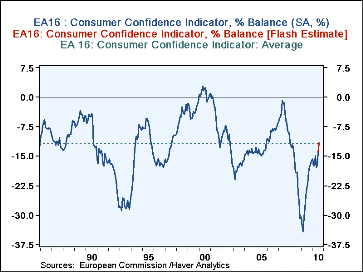
The Flash estimate has been a good indicator of the actual indicator as can be seen in the table below. The Flash estimate for August, released today, shows that the indicator has risen from -14.1% in July to -11.7%. While the indicator suggests that pessimists dominate the consumer outlook, it should be kept in mind that, over the history of the indicator, the highest percent balance was 2.7%, the lowest, -34.2% and the average, -11.9%. The August value is just a bit above the average. The second chart shows the flash estimates, beginning in January 2010, the actual consumer confidence indicator and the average of the actual series.
| Euro-Area Consumer Confidence (% balance) | Aug 10 | July 10 | Jun 10 | May 10 | April 10 | Mar 10 | Feb 10 | Jan 10 |
|---|---|---|---|---|---|---|---|---|
| Flash Estimate | -11.7 | -14.1 | -17.3 | -17.5 | -15.2 | -17.2 | -17.4 | -15.8 |
| Actual | -- | -14.2 | -17.3 | -17.8 | -15.0 | -17.3& | -17.4 | -15.8 |
| PMI | Euro-Area | France | Germany | -- | -- | |||
| Jul | Aug | Jul | Aug | Jul | Aug | -- | -- | |
| Composite | -56.7 | 56.1- | 59.7 | 59.0- | 59.0 | 59.3- | -- | -- |
| Manufacturing | -56.7- | 55.0 | 53.9 | 54.7 | 61.2- | 58.2- | -- | -- |
| Services | 55.8 | 55.6 | -61.1 | 59.9- | 56.5- | 58.5- | -- | -- |


