 Global| Nov 17 2008
Euro Area's September Trade Deficit of 5.7 Billion Euros Shows Little Change from August
Summary
The Euro Areatrade balance in September was -5,742 million euros virtually unchanged fromthe -5,705 million euros in August. It was, however, 8,549 million euros below the trade surplus of 2,807 million euros in September 2007. Since [...]

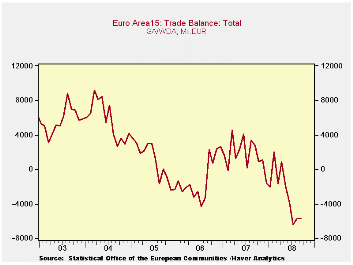
The Euro Areatrade balance in September was -5,742 million euros virtually unchanged fromthe -5,705 million euros in August. It was, however, 8,549 million euros below the trade surplus of 2,807 million euros in September 2007. Since December 2007, the trade balance in the Euro Area has, more often than not, been negative. The largest deficit of 6,387 million euros was recorded in July of this year, as can be seen in the first chart.
 Both high oil prices and a rising euro led to the
deterioration in the trade balance. High oil prices accounted for much
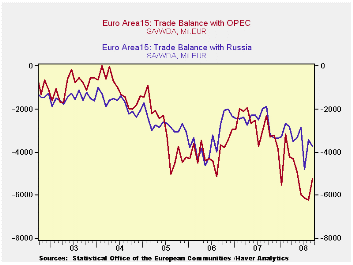
of the increasing trade deficits with Russia and OPEC earlier this
year. With the recent decline in the price of oil, the trade balance
with OPEC has become less negative. The trade balances with Russia and
OPEC are shown in the second chart.
The rising euro has dampened exports to and encouraged imports
from trading partners, leading to smaller surpluses or larger deficits.
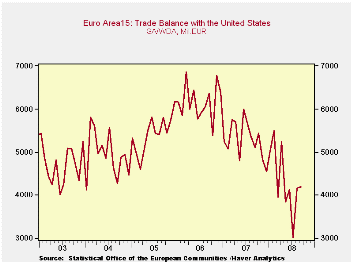
For example, the Euro Area's trade surplus with the United States has
fallen sharply over the last year and a half, as shown in the third
chart.
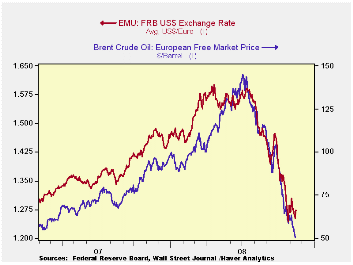
The price of oil and the value of the euro declined dramatically in recent months as the global financial crisis spread to more countries and intensified. The daily price of oil and the daily value of the euro are shown in the fourth chart. While the decline in the price of oil should reduce the Euro Area's imports, the effect of the decline in the euro is less predictable. Although it should be good for exports, falling world demand could outweigh the positive effects of the lower euro.


| EURO AREA 15 TRADE BALANCES | Sep 08 | Aug 08 | Sep 07 | M/M chg | Y/Y chg | 2007 | 2006 | 2005 |
|---|---|---|---|---|---|---|---|---|
| TOTAL | -5742 | -5705 | 2807 | -36 | -8549 | 20384 | -13049 | 10744 |
| With United States | 4197 | 4160 | 5098 | 37 | -901 | 63525 | 73914 | 65239 |
| With Russia | -3729 | -3429 | -1891 | -299 | -1837 | -30843 | -40429 | -32676 |
| With OPEC | -5235 | -6226 | -2286 | 981 | -2949 | -33532 | -48010 | -36611 |


