 Global| Dec 18 2006
Euro Zone Trade Shows a Surplus, but Rising Imports from China Add to Pressure on China to Speed Up Appreciation [...]
Summary
The Euro Zone's surplus on trade in October declined to 1,710.7 million euros from 2,418.0 million euros in September, but was 2,927.8 million euros above the deficit of 1,217.1 million euros in October, 2005. The traditional surplus [...]

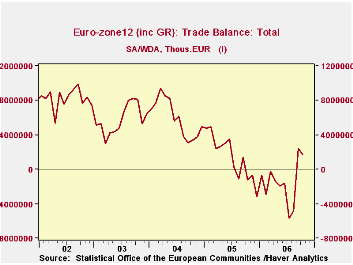
The Euro Zone's surplus on trade in October declined to 1,710.7 million euros from 2,418.0 million euros in September, but was 2,927.8 million euros above the deficit of 1,217.1 million euros in October, 2005. The traditional surplus on trade that the Euro Zone had enjoyed was turned into a deficit in mid 2005, due in part to increased oil imports and in part to the unrelenting surge in imports from China. The first chart shows the balance of trade for the Euro Zone with the rest of the world.
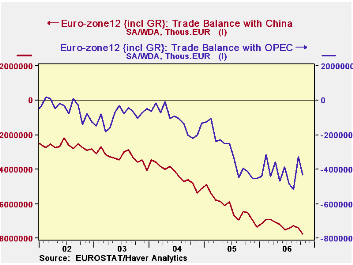
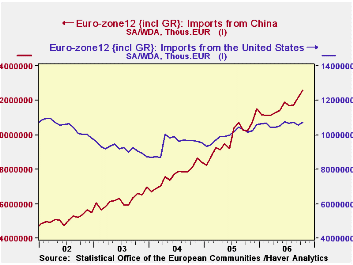
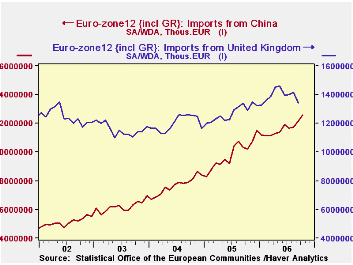
As the second chart shows the deficit with OPEC appears to have stabilized in recent months, but that with China continues to widen. Imports from China now exceed those from the United States, which had been the largest source of imports after the United Kingdom. The third chart compares imports from China with those from the US. While imports from China are now lower than those from the UK, the recent growth in these imports suggest it will not be too long before they exceed imports from the UK as can be seen in the fourth chart.
The imbalances resulting from China's growing surplus on its trade account with the Euro Zone is adding to the pressure already being exerted by the US to appreciate the Chinese Yuan.

| EURO ZONE TRADE IN GOODS (Mil. Euro) | Oct 06 | Sep 06 | Oct 05 | M/M % | Y/Y % | 2005 | 2004 | 2003 |
|---|---|---|---|---|---|---|---|---|
| Balance of Trade | 1,710.7 | 2,418.0 | -1,217.1 | -702.3* | 2,927.8* | 16,835.0 | 71,537.1 | 69,723.3 |
| China | -7,764.8 | -7,391.0 | -6,512.4 | -373.8* | -1,252.4* | -74,705.5 | -51,792.9 | -39,279.3 |
| OPEC | -4,321.9 | -3,265.7 | -4,130.3 | -1,056.2* | -191.6* | -36,858.0 | -13,422.0 | -10,731.9 |
| Imports | 118,727.7 | 117,964.5 | 106,537.8 | 0.65 | 11.44 | 1,224,700 | 1,075,342 | 990,435 |
| US | 10,725.0 | 10,557.8 | 10,144.6 | 1.58 | 5.72 | 120,158.3 | 113,775.4 | 110,326.1 |
| China | 12,582.8 | 12,170.7 | 10,231.3 | 3.39 | 22.98 | 118,120.7 | 92,060.4 | 74,515.0 |
| UK | n.a. | 13,430.2 | 12,888.2 | n.a. | n.a. | 152,360.0 | 144,047.1 | 138,863.4 |
More Economy in Brief
 Global| Feb 05 2026
Charts of the Week: Balanced Policy, Resilient Data and AI Narratives
by:Andrew Cates


