Global| May 15 2006
Europe Led the OECD Leaders Up
by:Tom Moeller
|in:Economy in Brief
Summary
During March, the Leading Index of the Major 7 OECD economies increased another 0.2% after five consecutive months of 0.4% gain. The leaders' six month growth rate held at 3.9%, its best since early 2004. During the last ten years [...]
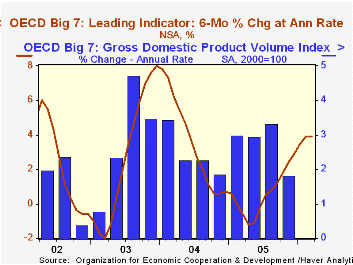
During March, the Leading Index of the Major 7 OECD economies increased another 0.2% after five consecutive months of 0.4% gain. The leaders' six month growth rate held at 3.9%, its best since early 2004.
During the last ten years there has been a 64% correlation between the change in the leading index and the q/q change in the GDP Volume Index for the Big Seven OECD countries.
Leaders in the European Union (15 countries) rose 0.4% on top of an upwardly revised 0.5% February rise. That improved the index's six month growth rate to 4.7%, the best since April 2004. During the last ten years there has been a 59% correlation between the change in the leading index and the quarterly change in the European Union GDP volume index.
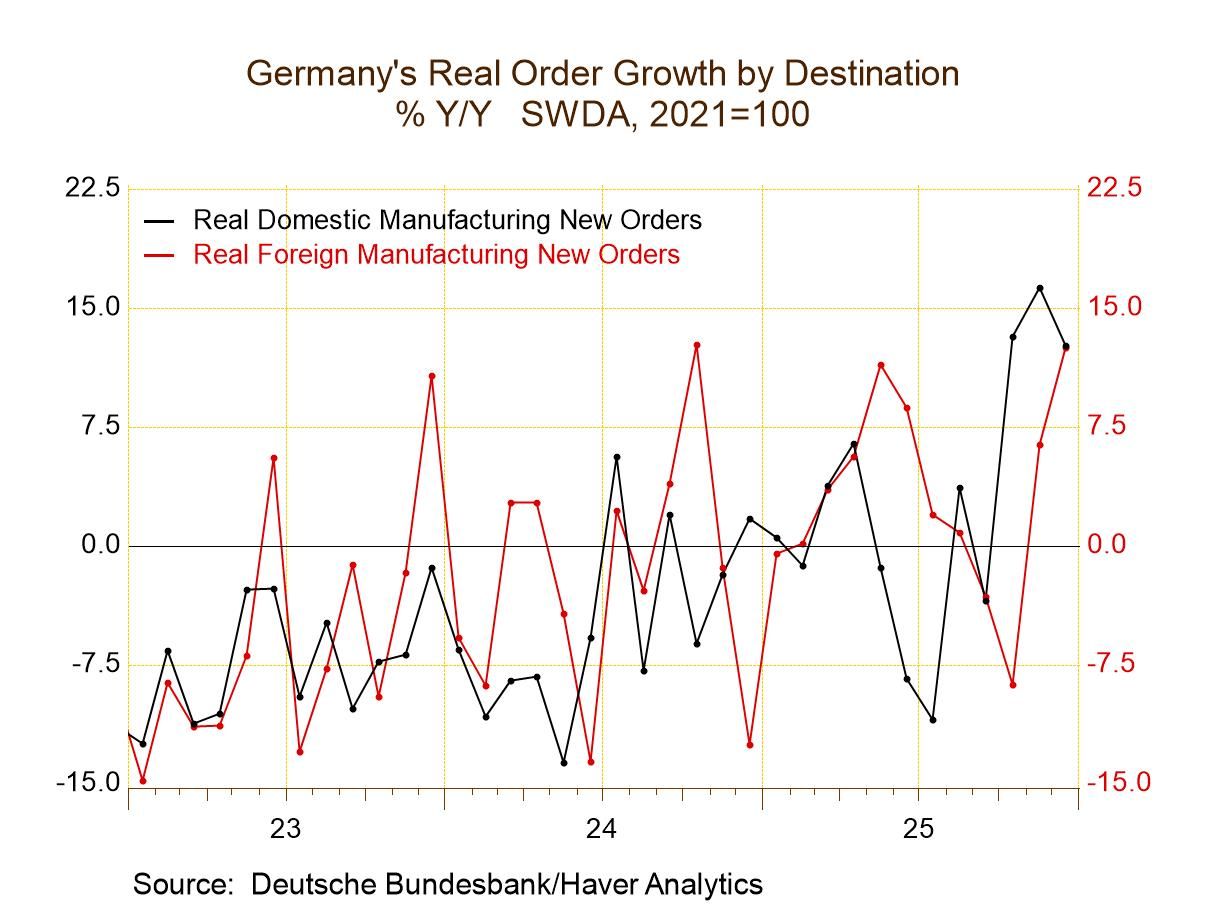
The 0.7% rise in theGerman leading index continued the trend of strong gain that started just under a year ago. The six month growth rate now is up to 8.4%, the highest level since December 2003, as the business climate indicator continued to surge along with new orders. Inventories fell to a record low versus trend. During the last ten years there has been a 32% correlation between the change in the German leading index and the quarterly change in GDP volume.
A leaders in France ticked up 0.1% and left the series' six month growth rate at a firm 3.9%. The industrial sector's prospects improved along with the future tendency of production. New car registrations rose but new job prospects & consumer confidence remained depressed.
The Italian leading index fell for the first time since last July. The 0.1% decline eased the series' six month growth rate to a still-improved 1.3%. New orders surged & the future tendency of production rose but consumer confidence remained depressed.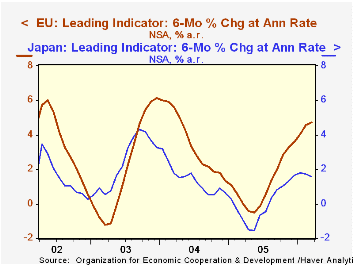
A 0.2% rise in the U.S. leaders was the slimmest gain since last September. Nevertheless, six month growth in the leaders was a firm 4.8% as share prices surged and the business climate indicator improved. The correlation between the leaders' growth rate and real GDP growth has been a high 73% during the last ten years.
The UK leaders jumped 0.6% after two months of small gain and improved the six month growth rate to 1.3%, its best since mid-2004. Share prices and the future tendency of production surged.
The Canadian leaders improved 0.3% following a 0.1% decline in February that was very much downwardly revised. The six month growth rate stood at still-improved 2.4%. The correlation of the leaders' growth with Canadian real GDP has been 49% during the last ten years.
The leading index in Japan was unchanged in March for the second consecutive month. That dropped the index's six month growth rate to 1.6%, its lowest since November. Share prices and loans-to-deposits were firm but imports versus exports fell to a twenty year low. The leaders' correlation with Japan's real economic growth has been a meaningful 40% during the last ten years.
The latest OECD Leading Indicator report is available here.
Recent Volatility Trends in the Foreign Exchange Market from the Federal Reserve Bank of New York can be found here.
| OECD | Mar | Feb | Y/Y | 2005 | 2004 | 2003 |
|---|---|---|---|---|---|---|
| Composite Leading Index | 105.28 | 105.03 | 2.1% | 102.75 | 102.40 | 97.87 |
| 6 Month Growth Rate | 3.9% | 3.9% | 0.6% | 3.6% | 2.8% |
by Tom Moeller May 15, 2006
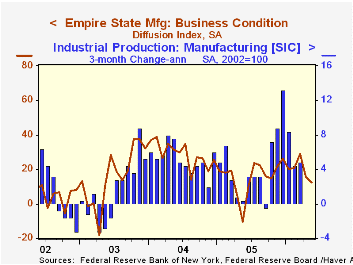
The Empire State Index of General Business Conditions for May slipped further to 12.36 from an unrevised 15.81 in April. These levels are down sharply from the series' March high of 29.03 and are reported by the Federal Reserve Bank of New York. Consensus expectations had been for stability at 16.2.
Since the series' inception in 2001 there has been a 76% correlation between the index level and the three month change in factory sector industrial production.
Many of the index components improved in May with the exception of employment which fell sharply to its lowest level since February. Orders & shipments both recovered modestly from sharp declines during April.
Pricing pressure recovered to the highest level since February.
Like the Philadelphia Fed Index of General Business Conditions, the Empire State Business Conditions Index reflects answers to an independent survey question; it is not a weighted combination of the components. 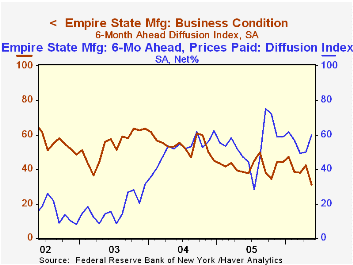
The index of expectations for business conditions in six months fell sharply to the lowest level since 2001 as expected pricing pressure rose and expected new orders fell.
The Empire State Manufacturing Survey is a monthly survey of manufacturers in New York State conducted by the Federal Reserve Bank of New York. Participants from across the state in a variety of industries respond to a questionnaire and report the change in a variety of indicators from the previous month. Respondents also state the likely direction of these same indicators six months ahead. April 2002 is the first report, although survey data date back to July 2001.
For more on the Empire State Manufacturing Survey, including methodologies and the latest report, click here.
| Empire State Manufacturing Survey | May | April | May '05 | 2005 | 2004 | 2003 |
|---|---|---|---|---|---|---|
| General Business Conditions (diffusion index) | 12.36 | 15.81 | -10.36 | 15.56 | 28.79 | 15.98 |
by Tom Moeller May 15, 2006
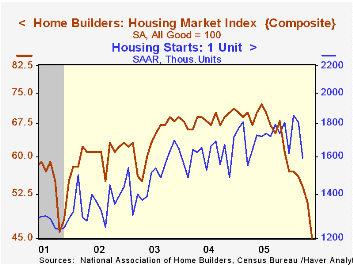
The National Association of Home Builders' (NAHB) reported that the May Composite Housing Market Index dropped 11.8% from April to the lowest level since June 1995. The figure was quite a bit weaker than Consensus expectations for stability at 50 and was one-third below the level of May 2005.
During the last twenty years there has been an 82% correlation between the y/y change in the annual composite index and the change in single family housing starts and there has been a 75% correlation between the current sales index and new single family home sales.
The sub indexes covering current sales of single family homes (-34.2% y/y) and sales in six months (-29.9% y/y) both fell roughly 9% month-to-month.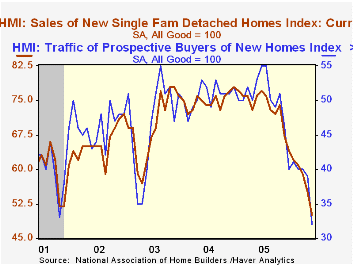
An index of the traffic of prospective home buyers plunged 17.9% m/m, also to more than a ten year low (-39.6% y/y).
Housing markets around the country weakened in May with the index for the Northeast off 6.0% (-32.9% y/y) and in the Midwest it fell 6.3% (-40.0% y/y). Out West the housing market index dropped 11.6% (-27.4% y/y) and in the South it fell 10.5% (-32.0% y/y).
The NAHB index is a diffusion index based on a survey of builders. Readings above 50 signal that more builders view conditions as good than poor.
Visit the National Association of Home Builders.
| Nat'l Association of Home Builders | May | April | May '05 | 2005 | 2004 | 2003 |
|---|---|---|---|---|---|---|
| Composite Housing Market Index | 45 | 51 | 70 | 67 | 68 | 64 |
by Louise Curley May 15, 2006
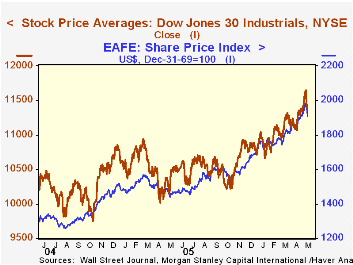
Stock markets around the world began to falter last week and continued to do so this morning. Both developed and emerging markets are succumbing to rising interest rates, the falling dollar and most recently signs of overshooting in commodity prices.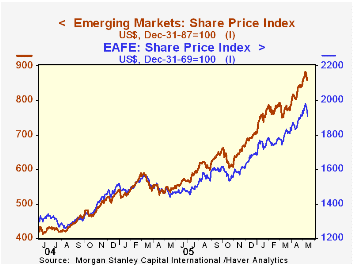
Morgan Stanley International Capital (MSCI) computes stock market indexes and returns on stock market investments for a wide range of individual countries and various aggregates. Among the latter are a world index, regional indexes, EAFE, (includes the developed markets of western Europe and Japan, Hong Kong, Singapore, Australia and New Zealand) and Emerging Markets, among others. The data are available on a daily, weekly and monthly bases in the Haver databases, MSCID, MSCIW, MSCIM.
The Dow Jones declined 1.76% from Monday, May 8th to Friday May 12th. The (MSCI) EAFE index declined 1.61% in the same period and MSCI's emerging market index fell 2.79%. The first chart shows the recent down turn in the Dow Jones Index and in MSCI's EFAE index. The second chart compares the trends in MSCI's EAFE and Emerging markets indexes.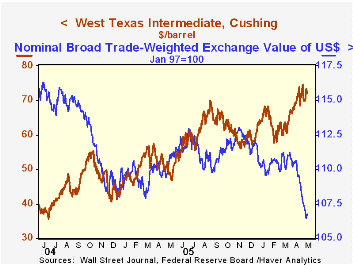
Haver Analytic's DAILY and WEEKLY databases of interest rates, commodity prices, and exchange rates provide much of the data needed to monitor the short term data that may affect stock markets. In the third chart we show the trade weighted value of the U. S Dollar and the price of oil as two of the many factors that may affect stock prices. The rise in oil prices generally has a dampening effect on domestic and foreign stock markets. The impact of a decline in the dollar may be mixed. As far as the US market is concerned it could be positive, but foreign markets are likely to view a decline in the dollar as a negative since it will make their exports less competitive.
| May 12 | May 11 | May 10 | May 9 | May 8 | % Change | |
|---|---|---|---|---|---|---|
| Dow Jones | 11380 | 11501 | 11643 | 11640 | 11584 | -1.76 |
| MSCI EAFE (12/31/69=1000 | 1938.7 | 1966.8 | 1973.1 | 1966.82 | 1970.5 | -1.61 |
| MSCI Emerging Mkts (12/31/87=100) | 856.9 | 873.3 | 879.9 | 881.2 | 881.5 | -2.79 |
| Trade Weighted Dollar (Jan 97=100) | 106.73 | 106.43 | 106.51 | 06.85 | 107.85 | -0.23 |
| Price of Oil Brent Crude ($ per barrel) | 71.49 | 72.30 | 69.74 | 70.66 | 68.83 | 3.86 |

Tom Moeller
AuthorMore in Author Profile »Prior to joining Haver Analytics in 2000, Mr. Moeller worked as the Economist at Chancellor Capital Management from 1985 to 1999. There, he developed comprehensive economic forecasts and interpreted economic data for equity and fixed income portfolio managers. Also at Chancellor, Mr. Moeller worked as an equity analyst and was responsible for researching and rating companies in the economically sensitive automobile and housing industries for investment in Chancellor’s equity portfolio. Prior to joining Chancellor, Mr. Moeller was an Economist at Citibank from 1979 to 1984. He also analyzed pricing behavior in the metals industry for the Council on Wage and Price Stability in Washington, D.C. In 1999, Mr. Moeller received the award for most accurate forecast from the Forecasters' Club of New York. From 1990 to 1992 he was President of the New York Association for Business Economists. Mr. Moeller earned an M.B.A. in Finance from Fordham University, where he graduated in 1987. He holds a Bachelor of Arts in Economics from George Washington University.
More Economy in Brief
 Global| Feb 05 2026
Charts of the Week: Balanced Policy, Resilient Data and AI Narratives
by:Andrew Cates