 Global| May 09 2006
European Industrial Production: Germany, an Unexpected Sharp Decline; Hungary and Slovakia, Show Continued Strength
Summary
March industrial production in Germany fell 2.4% in contrast to expectations of a small rise. The decline was the biggest monthly fall since June, 2000. Excluding construction, which declined by 14.5%, production still declined by [...]

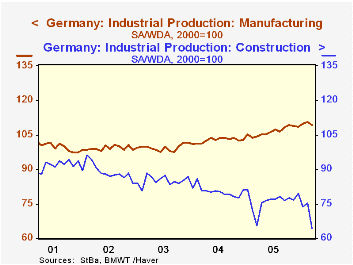
March industrial production in Germany fell 2.4% in contrast to expectations of a small rise. The decline was the biggest monthly fall since June, 2000. Excluding construction, which declined by 14.5%, production still declined by 1.7%. Manufacturing output declined 1.3% with declines in capital goods production of 2.5%, in consumer goods, 1.0%, in energy, 5.3% and in intermediate goods, 0.5%. Production in Manufacturing and Construction are compared in the first chart.
The set back in production is not necessarily a sign that the moderate upturn in the German economy is in danger. The month of March was unseasonally very cold, a fact that could account for some of the sharp drop in construction activity. In addition there was a brief work stoppage in late March when 700,000 workers in North Rhine-Westphalia were called off the job in connection with the 2006 wage negotiations of IG Metall (Germany's union of some 3.4 million engineering workers). The union's initial demand was for a 5% wage increase, but the workers in North Rhine-Westphalia subsequently settled for a 3% wage increase. Expectations are that this settlement will be accepted by the six remaining regional chapters of the union and become a model for a nationwide agreement.
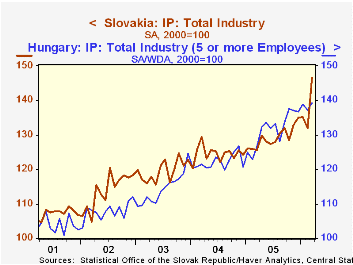
Industrial production in Eastern Europe continues to show strength--Slovakia, in particular, with an 11% rise in production from February to March. Production in Hungary was up a more modest 1.5% in the same period. Industrial production in the two countries is shown in the second chart. The year-over-year gains were 16.6% in Slovakia and 10.1% in Hungary. (These data are found in the Haver data base EMERGECW.) The data for Hungary are preliminary and are based on the output of firms with five or more employees.
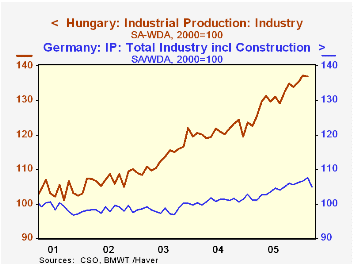
As an example of the different trends in industrial production in Western and Eastern Europe, production in Germany and Hungary are shown in the third chart.
| Industrial Production (2000=100) | Mar 06 | Feb 06 | Mar 05 | M/M % | Y/Y % | 2005 | 2004 | 2003 |
|---|---|---|---|---|---|---|---|---|
| Germany | ||||||||
| Total | 105.0 | 107.6 | 101.1 | -2.42 | 3.86 | 103.8 | 100.8 | 98.4 |
| Total ex Construction | 108.4 | 110.3 | 104.1 | -1.72 | 4.13 | 106.1 | 102.5 | 99.5 |
| Construction | 64.3 | 75.2 | 65.5 | -14.49 | -1.83 | 76.1 | 80.4 | 85.1 |
| Manufacturing | 109.2 | 110.2 | 104.3 | -1.27 | 4.70 | 106.6 | 102.7 | 99.4 |
| Hungary | 139.36 | 137.3 | 126.6 | 1.50 | 10.08 | 131.5 | 122.11 | 114.42 |
| Slovakia | 146.5 | 132.0 | 125.6 | 10.98 | 16.64 | 129.1 | 124.6 | 119.6 |


