 Global| Oct 12 2010
Exploring The Haver "Equities" Data Base
Summary
As noted in the September 2010 HAVER ANALYTICS NEWS, Haver Analytics has added a new data base, EQUITIES. The new database offers data on the capital markets of 78 countries. In addition to major price indexes, the database includes [...]
 As noted in the September 2010 HAVER ANALYTICS NEWS, Haver Analytics has added a new data base, EQUITIES.
The new database offers data on the capital markets of 78 countries. In addition to major price indexes, the
database includes P/E ratios, dividend yields, market capitalization, earnings and total return indexes.
The data are daily and many of the series begin in 1954. Historical data, going back to January 2005
are available for many of the FTSE stock market series reported in the Financial Times. The attached charts show
only a few examples from this rich data base.
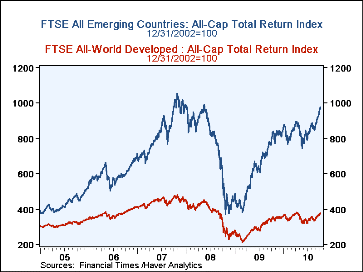
The total return indexes for All Cap Stocks in the Developed World and the Emerging World since January 2005 can seen in the first chart. Returns in the emerging markets grew faster, declined faster and recovered faster over the six years than those in the developed market. However, because the data are in index form, it is not possible to judge absolute values.
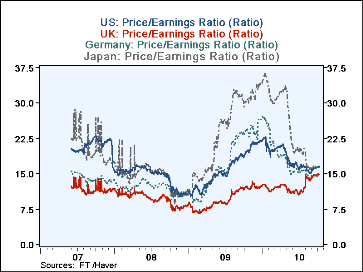
The relative value of stocks in various countries can be compared by their Price/Earnings Ratios. The second chart shows the Price/Earnings ratios for the United States, the United Kingdom, Germany and Japan as representative of the developed world. These data only go back to June, 2007, but they give a picture of stock market developments in the four countries over the recent boom and bust. While the P/E ratios of all four countries are currently close to each other, there were significant differences in the valuations of stock in the boom years. The declines from the boom peak to October 11, 2010 vary from 0.7% for the U.K. to 54.8% for Japan.
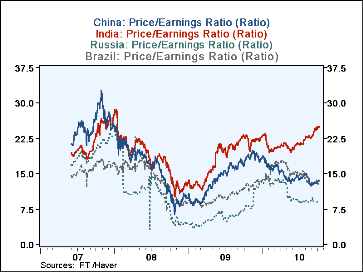
The third chart shows the valuation of stocks in the BRIC countries--Brazil, Russia, India and China--as representative of emerging markets. Russia experienced the biggest decline, 63.5%, from its boom peak, followed by a 58.0% decline for China and a 45.7% decline for Brazil. India is the surprise with only a 12.9% decline.
| Price/Earnings Ratios | Oct 11/10 | Peak | % Decline |
|---|---|---|---|
| Germany | 14.8 | 27.3 | 45.8 |
| Japan | 16.4 | 36.3 | 54.8 |
| UK | 14.9 | 15.0 | 0.7 |
| US | 16.6 | 23.0 | 27.8 |
| Brazil | 12.6 | 22.8 | 45.7 |
| Russia | 9.3 | 25.5 | 63.5 |
| India | 25.0 | 28.7 | 12.9 |
| China | 13.7 | 32.6 | 58.0 |
More Economy in Brief
 Global| Feb 05 2026
Charts of the Week: Balanced Policy, Resilient Data and AI Narratives
by:Andrew Cates


