 Global| Aug 10 2007
Fed Funds Futures Price in Easing, Dealer Trading Volume Favors Treasuries: More on Haver's Short-Term Financial Data
Summary
It's just past noon in New York as we're writing today and news services tell us stock markets have just turned positive on the day's trading. Current conditions in financial markets and among financial institutions suggest that we [...]

It's just past noon in New York as we're writing today and news services tell us stock markets have just turned positive on the day's trading. Current conditions in financial markets and among financial institutions suggest that we might benefit from a look at more of Haver's short-term financial data offerings besides the yield spreads we examined here about a week ago.
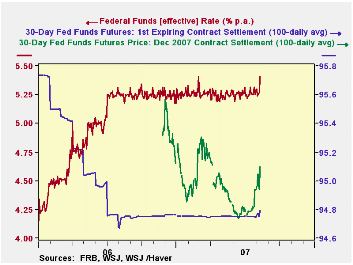
Yesterday - Thursday - the federal funds rate spiked well above the Federal Reserve's target, with an effective rate for the day of 5.41%. Generally, as seen in the table and the first graph, this rate runs just a few basis points either side of the target. So even the seemingly modest 16 basis points was a major move and indicative of tightening conditions in money markets. At the same time, this very market stress was reflected in rising prices of federal funds rate futures. These higher prices correspond to lower rates, signaling that market participants are starting to price in an easing by the Fed, through a reduction in their target funds rate. Again, we see in the graph that the nearby contract has hardly budged since July 2006, when markets were still anticipating more tightening. So the little blip we see over the very last few days is the most movement there's been in a year and it shows markets are starting to look seriously for the Fed to ease. The performance of the December contract, pushing up through 95 yesterday, indicates that traders expect the rate to be moved to 5% by December and with a non-trivial chance for 4.75%. These series, along with other Fed funds futures contracts, are in the "Interest Rates" menus of Haver's DAILY database.
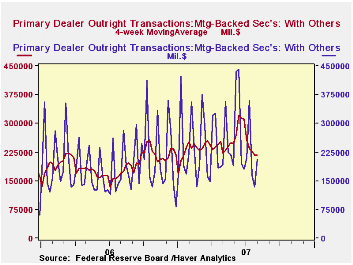
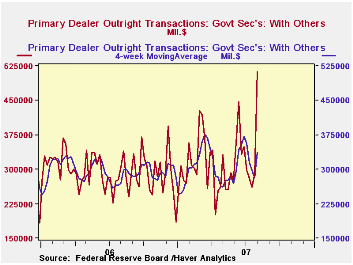
In the WEEKLY database, we can find some information about altered trading patterns and credit aggregates. The Federal Reserve collects data on transactions volume from the group of security dealers it trades with, known as "primary dealers". This dataset includes US Government securities, federal agency debt, the so-called "agency" mortgage-backeds (those issued by the Federal National Mortgage Association and the Federal Home Loan Mortgage Corporation), and corporate securities. We show here the dealers' trading volume in MBS and Governments. That in MBS has declined noticeably in the last three weeks. These figures are highly variable, but even using a four-week moving average, we see that the recent experience has the lowest turnover since January, which is typically a slow month. In contrast, trading in Governments has increased; the latest week, ended August 1, averaged $513.1 billion a day with customers ("Others" in this dataset, in contrast to inter-dealer brokers). This is a record by far, but with variability here, the four-week average does not yet exhibit such an extreme. It seems unlikely, though, that trading in Treasuries would have been much reduced in the subsequent periods. We'll watch that data closely next week to be sure.
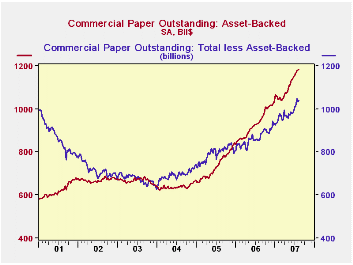
Finally, some packaged bonds and loans are financed in the short-term money markets through the vehicle of asset-backed commercial paper. Traditionally, commercial paper was unsecured debt issued by businesses to finance inventories or other aspects of daily operations. In the last several years, though, asset-backed paper has grown rapidly and is now larger than the more customary type of paper. The risks, even if only perceived risks, in asset-backed credit now involve this segment of the money markets, as well as the bond markets.
| DAILY | Aug 9 | Aug 8 | Aug 7 | Week Ago | Month Ago | 3 Mos. Ago |
|---|---|---|---|---|---|---|
| Fed Funds Rate | 5.41 | 5.27 | 5.26 | 5.24 | 5.22 | 5.21 |
| Fed FundsFutures Price: Sept | 94.875 | 94.775 | 94.755 | 94.785 | 94.760 | 94.795 |
| Dec | 95.100 | 94.940 | 94.965 | 94.965 | 94.765 | 94.920 |
| WEEKLY | Aug 8 | Aug 1 | July 25 | 4-Week Averages ending | ||
| June 27 | May 30 | Jan 3 | ||||
| Primary Dealer Transactions in Gov't Securities | --* | 513.1 | 290.1 | 371.4 | 270.3 | 246.0 |
| Primary Dealer Transactions in MBS | --* | 205.1 | 135.7 | 312.3 | 248.1 | 167.3 |
| Commercial Paper Outstanding | 2223.5 | 2212.7 | 2224.6 | 2127.4 | 2092.4 | 1970.5 |
| Asset-Backed | 1182.9 | 1180.8 | 1177.7 | 1143.5 | 1113.8 | 1038.6 |
Carol Stone, CBE
AuthorMore in Author Profile »Carol Stone, CBE came to Haver Analytics in 2003 following more than 35 years as a financial market economist at major Wall Street financial institutions, most especially Merrill Lynch and Nomura Securities. She had broad experience in analysis and forecasting of flow-of-funds accounts, the federal budget and Federal Reserve operations. At Nomura Securities, among other duties, she developed various indicator forecasting tools and edited a daily global publication produced in London and New York for readers in Tokyo. At Haver Analytics, Carol was a member of the Research Department, aiding database managers with research and documentation efforts, as well as posting commentary on select economic reports. In addition, she conducted Ways-of-the-World, a blog on economic issues for an Episcopal-Church-affiliated website, The Geranium Farm. During her career, Carol served as an officer of the Money Marketeers and the Downtown Economists Club. She had a PhD from NYU's Stern School of Business. She lived in Brooklyn, New York, and had a weekend home on Long Island.
More Economy in Brief
 Global| Feb 05 2026
Charts of the Week: Balanced Policy, Resilient Data and AI Narratives
by:Andrew Cates


