 Global| Nov 14 2007
Fed's Loan Officer Survey Shows Drastic Tightening of Mortgage Lending, Weakening of Banks' Mortgage Demand
Summary
This past spring, as disruptions in the residential mortgage market became more severe, the Federal Reserve's Division of Monetary Affairs revised some of the relevant questions on its quarterly Senior Loan Officer Opinion Survey. [...]

This past spring, as disruptions in the residential mortgage market became more severe, the Federal Reserve's Division of Monetary Affairs revised some of the relevant questions on its quarterly Senior Loan Officer Opinion Survey. Rather than inquiring about mortgage demand and lending policies in general, they broke the category down into three, "prime", "subprime" and "nontraditional". While this modification is more descriptive of banks' current situations, it gave no basis for comparison of current practice with previous periods.
So last week, following the release of the Q4 survey data, a number of Haver clients called the Client Hotline, asking if there wasn't something we could do with the information. Carol Stone here at Haver devised a method for re-combining the three new questions into an overall mortgage item.
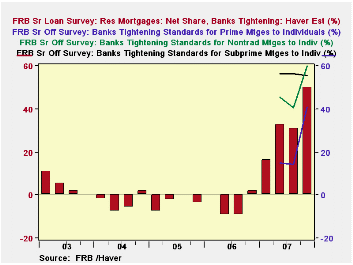
On the lending policy aspect, banks report whether they have "tightened" lending standards "considerably" or "somewhat" or "eased considerably" or "somewhat" or left their lending policy "basically unchanged". We simply added the responses together for each loan type and took that total as a percentage of the total responses. This ignores the response "do not offer" for each one, so the answers we've used cover only banks that are active lenders in each category.
The results show a dramatic policy shift. Through nearly all of 2006, banks were easing their lending approval criteria, at least in a modest way. They switched toward tightening in Q4 and then moved much more aggressively in the new year. The old "total" mortgage series shows a net tightening of 16.4% in the January survey; the Haver calculations show that doubling by April to 32.7% and reaching 50% in the latest poll. The actual measure here is a "net", that is, those tightening less those easing, but in the last three quarters, no one has eased lending standards. So the latest responses show 50% tightening and 50% "basically unchanged". In the table below, we show the original Federal Reserve series in regular typeface, and the Haver figures in italics.
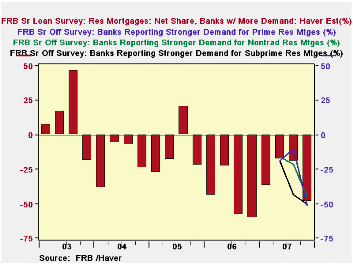
Demand for home mortgages -- at least as reported by the responding banks -- is weakening, although the recent performance here is no worse than last year. In fact, Q3 and Q4 of 2006 show the biggest negatives, -58.5% and -60.4%, respectively. During 2007, the weighted total of the new series moderated during the spring and early summer, but the latest survey shows renewed erosion to -48.5%. These demand figures reflect not only overall consumer demand for home purchase and/or other mortgage credit, but also the competitive mix of lending institutions. The moderation of banks' demand experience during part of this year could indicate a relative turn toward banks as mortgage companies and others pulled back more severely from the market.
We were cautioned by Federal Reserve analysts about making these combination series, and we, in turn, need to pass that caution to you as you use them. These are rough guides to the direction and degree of changes in bank mortgage lending standards and loan demand. But they cannot be numerically precise. The reason is that the three types of loans, prime, subprime and nontraditional, are not completely separate from each other. Prime loans include some nontraditional loans, as do subprime loans. Other nontraditional loans are classified by the lenders as a distinct category, neither prime nor subprime. So there is an indeterminate amount of double-counting in our simple summation of the total survey responses. Nonetheless, the resulting series look like what we'd expect: greatly tightening lending policies and weakening loan demand.
| Senior Loan Officers Survey | Oct 2007 | July 2007 | Apr 2007 | Jan 2007 | 2006 | 2005 | 2004 |
|---|---|---|---|---|---|---|---|
| Total Mortgages: Haver Series: Net Tightening | 50.0 | 30.8 | 32.7 | 16.4 | -4.2 | -3.4 | -3.4 |
| Prime | 40.8 | 14.3 | 15.1 | -- | -- | -- | -- |
| Nontraditional | 60.0 | 40.5 | 45.5 | -- | -- | -- | -- |
| Subprime | 55.5 | 56.3 | 56.3 | -- | -- | -- | -- |
| Haver Mortgage Series: Net Demand |
-48.5 | -19.4 | -17.7 | -37.0 | -46.5 | -11.9 | -19.1 |
| Prime | -51.0 | -10.0 | -18.9 | -- | -- | -- | -- |
| Nontraditional | -45.0 | -21.3 | -15.9 | -- | -- | -- | -- |
| Subprime | -50.0 | -43.8 | -18.8 | -- | -- | -- | -- |
Carol Stone, CBE
AuthorMore in Author Profile »Carol Stone, CBE came to Haver Analytics in 2003 following more than 35 years as a financial market economist at major Wall Street financial institutions, most especially Merrill Lynch and Nomura Securities. She had broad experience in analysis and forecasting of flow-of-funds accounts, the federal budget and Federal Reserve operations. At Nomura Securities, among other duties, she developed various indicator forecasting tools and edited a daily global publication produced in London and New York for readers in Tokyo. At Haver Analytics, Carol was a member of the Research Department, aiding database managers with research and documentation efforts, as well as posting commentary on select economic reports. In addition, she conducted Ways-of-the-World, a blog on economic issues for an Episcopal-Church-affiliated website, The Geranium Farm. During her career, Carol served as an officer of the Money Marketeers and the Downtown Economists Club. She had a PhD from NYU's Stern School of Business. She lived in Brooklyn, New York, and had a weekend home on Long Island.
More Economy in Brief
 Global| Feb 05 2026
Charts of the Week: Balanced Policy, Resilient Data and AI Narratives
by:Andrew Cates


