 Global| May 15 2007
First Quarter 2007 Growth in Europe's GDP Stronger than Expected
Summary
Eurostat issued its flash estimates for GDP growth in the 13 country Euro area and the 27 country European Union. In both cases the estimates showed, as expected, a deceleration from the 0.9% growth in the fourth quarter of 2006 to [...]

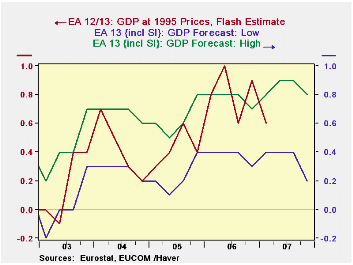
Eurostat issued its flash estimates for GDP growth in the 13 country Euro area and the 27 country European Union. In both cases the estimates showed, as expected, a deceleration from the 0.9% growth in the fourth quarter of 2006 to 0.6% in the first quarter of 2007. The consensus had expected a slightly greater deceleration to 0.5% for the first quarter. In addition to the first quarter flash estimate, Eurostat publishes an estimated range for the second, third and fourth quarters of the year for the GDP growth of the Euro Area. These ranges are shown in the first chart together with the actual flash estimates. The average estimate for the second quarter is 0.65%, the third quarter, 0.65% and the fourth quarter 0.5%. These data are found in the EUROSTAT data base.
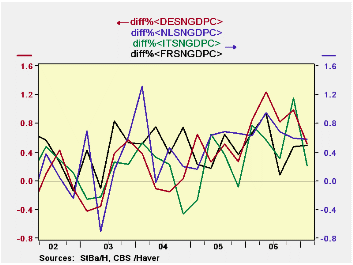
In addition to the flash estimates of percentage changes, published by Eurostat, some countries are beginning to release preliminary details of the composition of GDP for the first quarter. Among the countries of the Euro Area Germany, France, Italy and the Netherlands have published first quarter data, which can be found in the GERMANY, FRANCE, ITALY and BENELUX data bases. First quarter growth in Germany was 0.51%, a surprisingly good showing. Apparently the increase in the Value Added Tax of 3 points had little effect on demand. French growth was only slightly lower at 0.49%.Growth in Italy, however, was only 0.21%. The highest growth of the four was in the Netherlands where GDP grew 0.58% from the fourth quarter of last year to the first quarter of this year. The quarter to quarter growth rates are shown in the second chart.
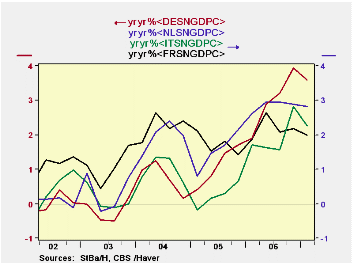
If the year over year growth in the first quarter is any indicator of the likely growth for the year as a whole, the 3.60% growth in Germany, suggests growth in 2007 may well be better than the 2.2% growth in 2006. Similarly, the first quarter growth in Italy suggests a better 2007, The first quarter year over year growth in France, on the other hand, suggests growth in 2007 could be lower than 2006. First quarter year over year growth in the Netherlands was almost equal to average growth in 2006 as can be seen in the table below.The year over year growth rates are shown in the third chart.
| FIRST QUARTER '07 ESTIMATES OF EUROPEAN GDP CHANGE (%) | Q1 07 Q/Q% |
Q4 06 Q/Q% |
Q1 07 Y/Y% |
Q4 06 Y/Y% |
2006 Y/Y% |
2005 Y/Y% |
2004 Y/Y% |
2003 Y/Y% |
|---|---|---|---|---|---|---|---|---|
| Euro Area | 0.6 | 0.9 | -- | -- | -- | -- | -- | -- |
| European Union | ||||||||
| Germany | 0.51 | 0.99 | 3.60 | 2.83 | 2.20 | 1.72 | 2.26 | 1.07 |
| France | 0.49 | 0.48 | 2.00 | 2.18 | 2.99 | 1.10 | 0.77 | -0.20 |
| Italy | 0.21 | 1.15 | 2.25 | 2.83 | 1.94 | 0.23 | 1.02 | 0.11 |
| Netherlands | 0.58 | 0.59 | 2.83 | 2.88 | 2.85 | 1.53 | 1.95 | 0.34 |


