 Global| Feb 13 2006
First Y/Y Increase in Japanese Corporate Prices of Final Goods Since 1998
Summary
Japan's corporations raised the average selling price of domestic goods 0.3% in January over January 2005. This was the first year-to-year increase since early 1998. The ability to raise prices, however small, was a welcome sign that [...]

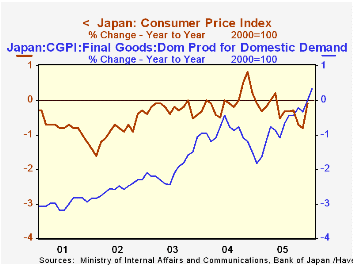
Japan's corporations raised the average selling price of domestic goods 0.3% in January over January 2005. This was the first year-to-year increase since early 1998. The ability to raise prices, however small, was a welcome sign that the long deflation may be coming to an end. The relationship between the domestic corporate good price index and the consumer price index is loose but logic suggests that a rise in the corporate price of goods will eventually be reflected in the consumer price level. The first chart shows the year-to-year changes in the domestic corporate goods price index for final goods and in the consumer price index.
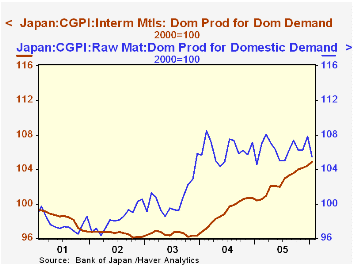
Prices of raw materials rose sharply in late 2003 and have remained relatively steady since then. Intermediate materials have continued to rise steadily and are now at the highest levels since the early 90's. The levels of these indexes are shown in chart two. In spite of the pressure of rising costs, corporations have been unable to raise final prices until this January. The prices of final goods, showed a very slight upward trend in 2005, but for the year as a whole, final prices averaged 91 or 9% below the level of 2000.
The Corporate Goods Price Index (CPGI) measures the prices of goods traded among companies. It is designed to show price developments that reflect supply and demand conditions.
| Japan: Corporate Prices and Consumer Price Index) | Jan 06 | Dec 05 | Jan 05 | M/M % | Y/Y % | 2005 | 2004 | 2003 |
|---|---|---|---|---|---|---|---|---|
| Corporate Goods Price Index (CGPI) (2000=100) | 102.8 | 102.7 | 97.0 | -0.29 | 5.57 | 100.1 | 97.1 | 96.0 |
| Domestic Corporate Goods Price Index (DCGPI) | 99.0 | 98.8 | 96.4 | 0.20 | 2.70 | 97.7 | 96.1 | 94.9 |
| Raw materials | 105.5 | 107.8 | 104.6 | -2.13 | 0.86 | 105.4 | 106.3 | 100.7 |
| Intermediate materials | 104.9 | 104.4 | 100.4 | 0.48 | 4.48 | 102.5 | 99.1 | 96.5 |
| Final goods | 91.0 | 91.1 | 90.7 | -0.11 | 0.33 | 91.0 | 91.8 | 92.6 |
| Year-to-year Change % | Jan 06 | Dec 05 | Nov 05 | Oct 05 | Sep | 2005 | 2004 | 2003 |
| Consumer Price Index | n.a. | -0.10 | -0.81 | -0.71 | -0.31 | 97.8 | 98.1 | 99.1 |
| Final goods | 0.33 | 0.00 | -0.33 | -0.22 | -0.44 | 91.0 | 91.8 | 92.6 |
More Economy in Brief
 Global| Feb 05 2026
Charts of the Week: Balanced Policy, Resilient Data and AI Narratives
by:Andrew Cates


