 Global| Aug 03 2007
Gasoline Prices Ease Further; Refining Margins Reduced
Summary
Higher crude oil prices were a contributing factor in the recent stock price gyrations, as West Texas Intermediate (WTI) looked to be approaching $80/barrel. The high spot price came Tuesday, July 31, at $78.22; by yesterday, it had [...]
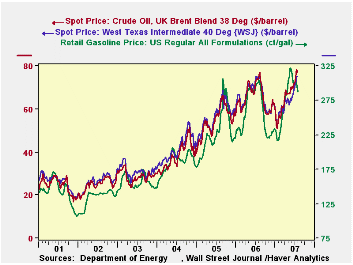
Higher crude oil prices were a contributing factor in the recent stock price gyrations, as West Texas Intermediate (WTI) looked to be approaching $80/barrel. The high spot price came Tuesday, July 31, at $78.22; by yesterday, it had eased to $76.87. For UK Brent, yesterday's close was $76.29 after several days over the last couple of weeks that were above $78.00, with a high of $79.09 on July 20.
The most recent demand data show world petroleum use of 86.1 million barrels/day (mb/d) in June, up 2.1% from May and the fourth largest monthly amount ever. This estimate is from Oil Market Intelligence and is included in the OMI database that Haver markets in partnership with OMI's parent, Energy Intelligence. Generally, as seen in the second graph here, while the latest month's demand is up, the last 18 months or so have kept to a range around a fairly flat trend; growth over the year-ago period was a modest 0.6% in June.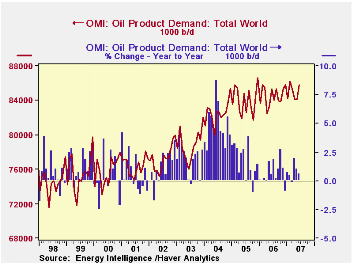
In the US, demand has been steady in recent weeks just over 20.9 mb/d, down from the spring's highs of about 21.3 mb/d. For July, this was about 1.0% above year-earlier amounts. As we have mentioned before here, US product demand, especially for gasoline, did not ease last winter as is usually the case. Thus, in the last three months, while US use of gasoline has remained higher than a year ago, that growth has slowed markedly from what it was in the mild wintertime. Even so, inventories have stayed tight, and the days' supply measure remains at just 21.4, noticeably below anytime prior to last winter (except during severe hurricanes).
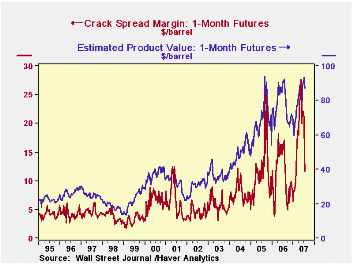
Despite higher crude prices and the tight supply of gasoline, the latest retail gasoline prices have been down a bit. In the July 30 week, the national average for regular was $2.876/gallon, off 8.2 cents from the prior week and below the year-ago $3.004. This combination impacts petroleum refiners. With gasoline prices a bit lower when crude is higher, there is considerable pressure on the refining margin, or the "crack spread". In the July 27 week, it was $11.71/barrel, down from $20.50 just two weeks earlier and and an average of $22.85 across April, May and June. While this latest is much lower than just a few weeks ago, it is not "low" historically. Prior to 2004, this weekly figure had been above $10 only about half-a-dozen times. At the same time, on a percentage basis, the current number is more representative: it is 13.5% of the "estimated product value", a ratio well within the range of the last five or six years and indeed below the customary amount in prior times.
Sometimes, when oil prices rise, the stock market can respond favorably, as oil companies may see higher profits. But the current restraint on gasoline prices and the squeeze on refining margins suggests that this may not necessarily be the present outcome.
The weekly oil-market data are contained in Haver's OILWKLY database, maintained in conjunction with the Oil and Gas Journal. Daily prices are in the DAILY database.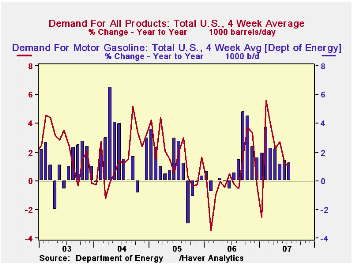
| Select Oil Market Indicators | Aug 2 (Day) | July 27, 2007 | July 20, 2007 | July 28, 2006 | 2006 | 2005 | 2004 |
|---|---|---|---|---|---|---|---|
| Gasoline, US Regular Grade (cents/gal) | -- | 287.6 | 295.8 | 300.4 | 257.2 | 227.0 | 185.2 |
| Crude: WTI ($/barrel) | 76.87 | 75.24 | 74.95 | 73.97 | 66.13 | 56.50 | 41.33 |
| Crude: UK Brent ($/barrel) | 76.29 | 77.22 | 78.35 | 73.39 | 65.19 | 54.58 | 38.10 |
| Gasoline Stocks: Days' Supply | -- | 21.4 | 21.4 | 22.2 | 22.7 | 22.8 | 23.2 |
by Robert Brusca August 3, 2007
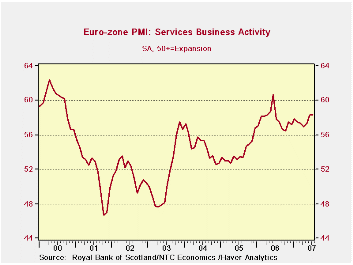
Service sector in clear slow down as the index drops from its peak.
The slowdown in the services sector indicated by the NTC service sector index is, in its character, much like that in the MFG sector with only some small shifts in the date of past cycle peaks. Like the MFG sector report, the service sector shows that a slowdown is in train. Also like the MFG report the services sector slowdown is at a slower pace than it has been in the past. Indeed on the chart the hopeful sign is that after its retrenchment services may once again be back in the growth channel and growing.
Right now the Euro area economy is 13 months past it service sector peak for this cycle. At this point the index is lower by 3.8%. In the previous three cycles at the 13 month mark the services index would have been down by 9.5% from that peak. That is to say that the slowdown would have been more severe by about one third. Although some of the past cycles peaked at a high point than this one has, due to the slower erosion of the service index, the current index not only has fallen by less, but it stands at a higher point than for any of the past cycles 13-months past their peak.
The UK continues to break the mold and to part company with EMU members as the drop in the UK service sector brings it to its lowest level since Sept of 2006. Most EMU countries are seeing the service sector rebound over the past two months; for the UK it’s been erosion. For the main EU countries their services indexes were last lower in May or June of this year, very recently. So the rebound is very tentative.
Still, based on the range of values since early 2000 it is Germany with the relatively strongest service sector. Its 58.47 reading for the service sector is still in the top 15 percentile of its values over the period. As an individual country, the UK would be the second highest in its range for the grouping in terms of its service sector rank within its range, but for the whole of EMU the services index stands in the top 22 per cent of its range, above the UK on this score. In terms of raw services readings the UK reading of 57.0 is not strong, but comparisons across countries are better done with reference to each countries’ own range since variability characteristics are not standardized across countries.
Hold that pose - our picture of Europe. The picture we get of Europe is that the MFG indexes are sliding and so are the services measures. But the pace of slippage is less than what it has been in the past. At the same time employment conditions (unemployment) are improving. The labor market always lags activity so this is not telling yet. The interesting question for Europe is whether this slide will stop the improvement in unemployment or whether it is a minor meltdown that will permit unemployment progress to continue. If unemployment progress continues, there is some chance to pull the retail sector into the recovery it has not yet joined and to thereby extend the expansion.
Right now the performance of Europe is remarkable given the strength of the euro (and the pound) as those currencies have still been edging higher this year from already high levels. With exporters more ‘up against it’ for competitiveness reasons, an improvement in domestic demand based on the consumer supported by a still improving job market is just what Europe needs. However, it is not clear if that is attainable especially with the ECB and BOE worried over inflation trends and with each block poised to hike rates. Lurking in the background, should recovery slip, is the pressure, right now emanating from France, to press more on China over trade issues. Protectionism is always more compelling when domestic growth weakens.
| Jul-07 | Jun-07 | 3-Mo | 6-Mo | 12-Mo | Percentile* | |
| Euro-13 | 58.34 | 58.33 | 57.98 | 57.63 | 57.42 | 78.5% |
| Germany | 58.47 | 58.88 | 58.27 | 57.90 | 56.91 | 85.8% |
| France | 58.93 | 58.98 | 58.61 | 58.77 | 59.40 | 60.7% |
| Italy | 58.46 | 57.92 | 57.64 | 56.18 | 55.81 | 71.8% |
| Spain | 56.33 | 55.31 | 55.95 | 55.91 | 56.94 | 68.4% |
| Ireland | 56.19 | 56.93 | 56.00 | 58.37 | 59.49 | 47.9% |
| EU only | ||||||
| UK | 57.02 | 57.74 | 57.31 | 57.36 | 58.06 | 75.2% |
| *Percentile is over range since May 2000 | ||||||
by Robert Brusca August 3, 2007
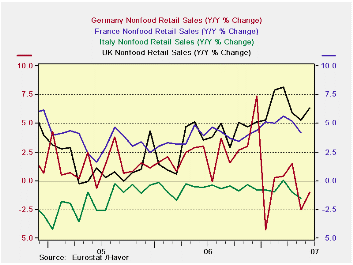
With Q2 data complete, at least preliminarily, Euro area retail sales are continuing to show lethargy. For the quarter as a whole, retail sales volumes are up by only 0.6% at an annual rate over Q1. This follows a 0.2% result in Q1. Food purchases are off by 0.1% at an annual rate in Q2. Nonfood is doing somewhat better with a Q/Q annual rate gain of 1.4%. Still, this is no growth leader.
Germany is poised for a normal ‘German recovery’ to take hold – or so officials continue to say. This means that after a trade-led rebound with a strong capital goods sector, the consumer joins the party late. So far there is little evidence that Germany has turned that corner. The VAT hike at year end has surely been a part of the reason. But we are now at mid-year and German sales in Q2 are compared to a VAT distorted and weak Q1. And while Germany’s retail volumes are up at a strong-seeming 6.5% annual rate in Q2/Q1 that compares to a -15.8% drop in Q1, it isn’t really much of a rebound. Year-over-year German sales volumes are off by 0.7%. For all of the Euro area the Y/Y sales gain is 1.0%; nearly twice that for nonfoods at a 1.8% annual rate.
Within Europe the UK (not an EMU member but an EU member and one with a still strong exchange rate) continues to show strong retail sales results. The UK housing market is still strong. The Bank of England, like the ECB, is still warning about inflation pressures and probably is headed for another rate hike. But the UK consumer has been much more active that the typical Euro area consumer. In EMU, unemployment rates are still high, but they have been falling steadily. The proximity to low cost Eastern Europe may be one factor holding back consumer optimism. But one thing is clear, as surely as Europe has had a solid recovery underway, the consumer has been left behind. If Euro area job market improvement continues, this should change, but so far there is little evidence of it and leading economic barometers are showing that a tendency to slow is in the pipeline.
| Jun-07 | May-07 | Apr-07 | 3-Mo | 6-MO | 12-Mo | |
| Euro area 13 Total | 0.4% | -0.7% | -0.1% | -1.3% | -0.6% | 0.9% |
| Food | 0.0% | -0.7% | -0.1% | -3.3% | -0.5% | -0.7% |
| Nonfood | 0.8% | -0.7% | 0.1% | 0.6% | 0.0% | 2.1% |
| Textiles | #N/A | -3.1% | 1.4% | -6.5% | -1.3% | 0.0% |
| HH Goods | #N/A | -0.4% | -1.0% | -1.8% | -2.5% | 1.0% |
| Books news, etc | #N/A | -0.7% | -0.3% | -1.1% | -0.6% | 0.3% |
| Pharma | #N/A | 0.5% | 0.1% | 3.7% | 3.4% | 3.4% |
| Other NonSpec | #N/A | -0.7% | -0.8% | -3.3% | -2.1% | -1.6% |
| Mail Order | #N/A | 1.4% | 0.7% | 1.7% | 3.1% | 0.0% |
| NonFood Country detail;Volume | ||||||
| Germany | 1.6% | -3.4% | 2.2% | 1.2% | -10.0% | -1.0% |
| France | #N/A | 0.0% | 0.1% | 3.6% | 4.3% | 4.2% |
| Italy (Total; Value) | #N/A | -0.2% | -0.5% | -2.1% | -2.2% | -1.6% |
| UK (EU) | 0.9% | 0.3% | -0.1% | 4.7% | 5.2% | 6.4% |
| Shaded areas calculated on a one-month lag due to lagging data. | ||||||
| The EA 13 countries are Austria, Belgium, Finland, France, Germany, Greece, Ireland, Italy, Luxembourg, the Netherlands, Portugal, Slovenia and Spain. | ||||||
| 7COLSPAN | ||||||
by Tom Moeller August 3, 2007
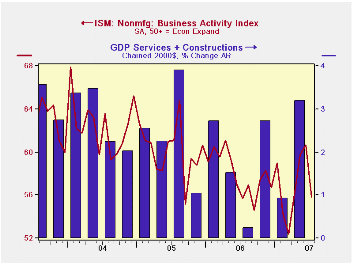
The non-manufacturing sector Business Activity Index for July fell back to 55.8 from an unrevised 60.7 during the prior month according to the Institute for Supply Management.
Since the series' inception in 1997 there has been a 46% correlation between the level of the Business Activity Index and the Q/Q change in real GDP for services plus construction.
The employment sub index also fell to 51.7 from the high of 55.0 in June. Since the series' inception in 1997 there has been a 56% correlation between the level of the ISM non-manufacturing employment index and the m/m change in payroll employment in the service producing plus the construction industries.
The new orders index also fell m/m to 52.8 from 56.9 in June, down for the second month in a row but the latest still indicates growth in new orders.
Pricing power also slipped for the second month, but by a hard 4.2 points to 61.3, the lowest level since February. Since inception eight years ago, there has been a 70% correlation between the price index and the y/y change in the GDP services chain price index.
ISM surveys more than 370 purchasing managers in more than 62 industries including construction, law firms, hospitals, government and retailers. The non-manufacturing survey dates back to July 1997.Business Activity Index for the non-manufacturing sector reflects a question separate from the subgroups mentioned above. In contrast, the NAPM manufacturing sector composite index is a weighted average five components..
| ISM Nonmanufacturing Survey | July | June | July '06 | 2006 | 2005 | 2004 |
|---|---|---|---|---|---|---|
| Business Activity Index | 55.8 | 60.7 | 55.7 | 58.0 | 60.2 | 62.5 |
| Prices Index | 61.3 | 65.5 | 72.1 | 65.2 | 68.0 | 68.8 |
by Tom Moeller August 3, 2007
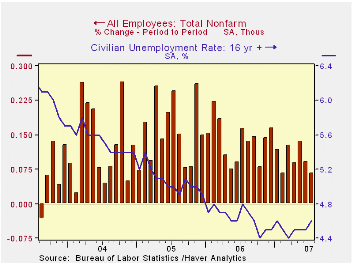
Nonfarm payrolls grew 92,000 during July. The increase was a bit below the Consensus forecast for a 128,000 rise and the prior two months' gains were revised slightly downward.
The three month change in payrolls slowed to 135,000 on average. That's about equal to the 136,000 average change so far this year but below the average of 189,000 last year and 212,000 during 2005.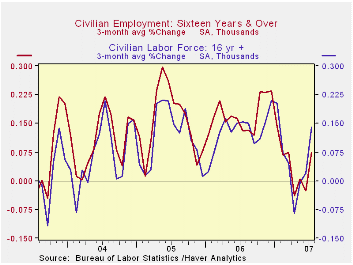
The unemployment rate moved up to 4.6% last month from 4.5% during June. Household employment fell 30,000 (+1.2%) following a 197,000 rise during June. The labor force jumped another 159,000 (1.1% y/y). The labor force participation rate held steady at 66.1%.
From the establishment survey, private service sector jobs posted a 132,000 (2.0%) gain after a 114,000 June rise which was revised slightly higher. Last year’s average gain was 159,000 per month. Retail employment actually fell a modest 1,200 (+0.5% y/y) during July and the average this year has been just 8,000 per month after an outright decline of 2,700 per month during 2006. In the financial sector, jobs recovered from the prior month's 2,000 decline and grew 27,000 (1.4% y/y) for an average gain of 7,000 this year versus 16,000 last year. Professional & business services employment rose 26,000 after June's upwardly revised 7,000 increase. The average gain this year has been 19,000 per month, off from last year's average of 42,000.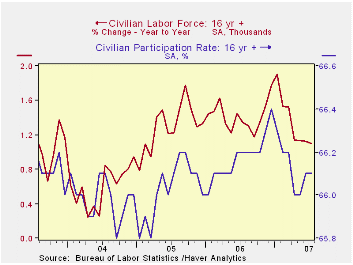
Factory sector payrolls fell 2,000 (-1.2 y/y) and jobs have fallen in every month during the last twelve. Construction employment reversed the prior month's downwardly revised 3,000 increase with a 12,000 (-0.7% y/y) decline. Construction jobs have fallen 5,000 per month this year versus an average 11,000 increase per month during 2006.
Government payrolls fell 28,000 (+1.1% y/y) and in 2007 have risen an average 16,000, near the per month average last year of 20,000.
Average hourly earnings increased 0.3% and the 0.4% gain in June was upwardly revised. Factory sector earnings rose 0.3% (3.0% y/y) and private service producing earnings rose a firm 0.4% (4.1% y/y) after June's upwardly revised 0.5% increase. The monthly average increase in overall average hourly earnings this year has been 0.3% versus, down from 0.4% per month last year.
Phillips Curve Instability and Optimal Monetary Policy from the Federal Reserve Bank Of Kansas City is available here.
| Employment | July | June | Y/Y | 2006 | 2005 | 2004 |
|---|---|---|---|---|---|---|
| Payroll Employment | 92,000 | 126,000 | 1.4% | 1.9% | 1.7% | 1.1% |
| Manufacturing | -2,000 | -13,000 | -1.2% | -0.2% | -0.6% | -1.3% |
| Average Weekly Hours | 33.8 | 33.9 | 33.9 (July '06) | 33.8 | 33.8 | 33.7 |
| Average Hourly Earnings | 0.3% | 0.4% | 3.9% | 3.9% | 2.8% | 2.1% |
| Unemployment Rate | 4.6% | 4.5% | 4.8% (July '06) | 4.6% | 5.1% | 5.5% |
Carol Stone, CBE
AuthorMore in Author Profile »Carol Stone, CBE came to Haver Analytics in 2003 following more than 35 years as a financial market economist at major Wall Street financial institutions, most especially Merrill Lynch and Nomura Securities. She had broad experience in analysis and forecasting of flow-of-funds accounts, the federal budget and Federal Reserve operations. At Nomura Securities, among other duties, she developed various indicator forecasting tools and edited a daily global publication produced in London and New York for readers in Tokyo. At Haver Analytics, Carol was a member of the Research Department, aiding database managers with research and documentation efforts, as well as posting commentary on select economic reports. In addition, she conducted Ways-of-the-World, a blog on economic issues for an Episcopal-Church-affiliated website, The Geranium Farm. During her career, Carol served as an officer of the Money Marketeers and the Downtown Economists Club. She had a PhD from NYU's Stern School of Business. She lived in Brooklyn, New York, and had a weekend home on Long Island.
More Economy in Brief
 Global| Feb 05 2026
Charts of the Week: Balanced Policy, Resilient Data and AI Narratives
by:Andrew Cates


