 Global| Dec 23 2008
GDP Data For Third Quarter Of 2008: Paths To Recession
Summary
The United Kingdom, the United States, Denmark, the Netherlands and New Zealand released their, for the most part, final estimates of Gross Domestic Product for the third quarter of 2008 today. The quarterly percent changes in GDP for [...]

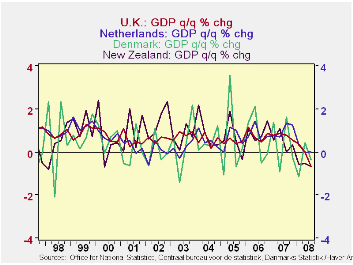
The United Kingdom, the United States, Denmark, the Netherlands and New Zealand released their, for the most part, final estimates of Gross Domestic Product for the third quarter of 2008 today. The quarterly percent changes in GDP for New Zealand, Denmark, the Netherlands and the U.K. are shown in the first chart.
All five countries appear to be in recession or heading
towards it although their paths are diverse. The data show that New
Zealand has now reported three successive quarters of decline and is
definitely in recession. After a rebound in the second quarter, Denmark
has once again reported a decline in GDP. GDP in the Netherlands has
hovered around zero growth in all three quarters of 2008. GDP in the U.
K. declined 0.65% in the third quarter, more than expected and the
biggest decline since 1990. GDP in Denmark declined 0.38% in the third
quarter after rising 0.43% in the second quarter. As can be seen in the
first chart, quarterly movements in Denmark's GDP are much more
volatile than those of the other countries shown.
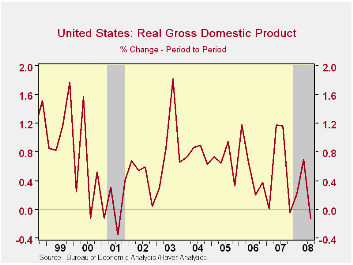
GDP in the United States, which had declined 0.04% in the fourth quarter of 2007, increased by 0.22 % in the first quarter of 2008 and 0.70% in the second quarter, declined 0.13% in the third quarter. (The U. S. typically shows quarterly changes in GDP at annual rates, while most other countries use quarterly changes such as those shown here. The comparable annual rate figures for the U. S. are -0.17%, 0.87% , 2.83 % and -0.51% respectively.)
The National Bureau of Economic Research, the arbiter of recession dating in the U. S., has declared the fourth quarter of 2007 to be the peak of the expansion and thus the first quarter of 2008, the beginning of recession. Quarterly changes in the GDP of the U. S together with recession shading are shown in the second chart. Other countries have yet to make an official announcement, but when they do, Haver will record the recession dating and shading in the Graph Menu in DLXVG3.
| QUARTERLY CHANGES IN GDP | Q3 08 | Q2 08 | Q1 08 | Q4 07 |
|---|---|---|---|---|
| New Zealand | -0.68 | -0.52 | -0.57 | 0.33 |
| Denmark | -0.38 | 0.43 | -1.16 | -0.23 |
| The Netherlands | -0.02 | 0.00 | 0.33 | 1.25 |
| United Kingdom | -0.65 | 0.00 | 0.38 | 0.55 |
| United States | -0.13 | 0.70 | 0.22 | -0.04 |
More Economy in Brief
 Global| Feb 05 2026
Charts of the Week: Balanced Policy, Resilient Data and AI Narratives
by:Andrew Cates


