 Global| Jun 22 2009
German Business ConfidenceImproving But Still Subdued
Summary
Germany's IFO institute reported today that its business climate index rose to 85.9 (2000=100) in June up from 84.3 in May. This was the third month of improvement. The business climate index is made up of the business community's [...]

Germany's IFO institute reported today that its business
climate index rose to 85.9 (2000=100) in June up from 84.3 in May. This
was the third month of improvement. The business climate index is made
up of the business community's appraisal of current conditions and the
economic outlook six months ahead. There was a small decline in the
appraisal of current conditions, from 82.5 to 82.4 which was more than
offset by a significant improvement in the outlook six months ahead
from 86.0 to 89.5.
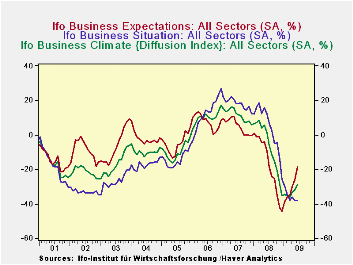
Although these signs are encouraging, business confidence remains subdued. The business climate index is lower than the 100 mark, which represents conditions back in 2000 and even much lower than the recent peak of 109.1, reached in December 2006. There are still many more pessimists than optimists--38.3%-- regarding current conditions. While the outlook for the next six months has improved, there are still 18.8% more of the respondents who are pessimistic about the outcome than those who are optimistic. The percent balances for the Business Climate, Current Conditions and Outlook for the next six months are shown in the first chart.
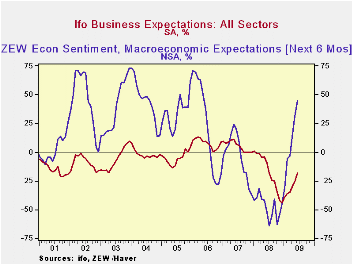
Just last week the ZEW survey revealed that the financial community was decidedly more optimistic about the future of the economy. Since April optimists in the financial community have outweighed pessimists regarding the six months outlook. In June the excess was 44.8%, up from 31.1% in May and 13.0% in April. The second chart compares the percent balances of opinions on expectations for the business and financial communities. Expectations of both communities tend to move in the same direction but the expectations of the financial community tend to be much more volatile than those of the business community. Part of the greater volatility of the ZEW survey may be due, in part, to its small sample size. The ZEW sample in June consisted of 271 institutional investors and financial analysts, while the IFO sample consisted of some 7000 representatives of manufacturing, construction and wholesaling and retailing.
| German Business Confidence | Jun 09 | May 09 | Apr 09 | Mar 09 | Feb 09 | Jan 09 |
|---|---|---|---|---|---|---|
| IFO (2000=100) | -- | -- | -- | -- | -- | -- |
| Business Climate | 85.9 | 84.3 | 83.7 | 82.2 | 82.6 | 83.1 |
| Current Conditions | 82.4 | 82.5 | 83.5 | 82.7 | 84.3 | 86.7 |
| Expectations | 89.5 | 86.0 | 84.0 | 81.7 | 81.0 | 79.6 |
| IFO ( % Percent Balance) | -- | -- | -- | -- | -- | -- |
| Business Climate | -28.9 | -32.1 | -33.1 | -36.2 | -35.4 | -34.4 |
| Current Conditions | -38.3 | -38.0 | -36.1 | -37.8 | -34.7 | -29.8 |
| Expectations | -18.8 | -25.9 | -30.1 | -34.7 | -36.1 | -38.9 |
| ZEW (% Percent Balance) | -- | -- | -- | -- | -- | -- |
| Expectations | 44.8 | 31.1 | 13.0 | -3.5 | -5.8 | -31.0 |
by Robert Brusca June 22, 2009

The EMU (16-country) consolidated balance of trade with
countries outside the region fell to eru336mln in April from eur1.7bln
in March. The Year-to-date deficit of eur2.5BLn is below the YTD
average for the same period of a year ago that stood at eur 1.1bln.
Over the last year and the last six months exports and imports
are declining at about the same speed in percentage terms. But over the
last three months exports have stabilized dropping at just a 0.5%
annual rate compared to imports whose decline is at a 17% annual rate.
So the export decline has been out ahead of the import decline until
this month when more stable exports allowed imports to catch up with
the export Yr/Yr and six month trends.
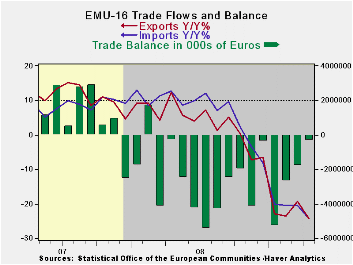
The bar chart shows that the goods deficit has been on an
improving trend for the last four months but before that the
performance had been somewhat erratic. Year-over-Year export and import
declines now are very much in step.
| Ezone 16-Trade trends for goods | ||||||
|---|---|---|---|---|---|---|
| m/m% | % Saar | |||||
| Apr-09 | Mar-09 | 3M | 6M | 12M | 12M Ago | |
| Balance* | €€ (336) | €€ (1,780) | €€ (1,396) | €€ (2,432) | €€ 399 | €€ (183) |
| Exports | ||||||
| All Exp | -1.3% | 1.5% | -0.5% | -36.6% | -24.3% | 12.4% |
| Food and Drinks | -1.3% | 2.9% | 4.7% | -21.3% | -12.1% | 18.2% |
| Raw materials | 0.6% | 10.6% | 66.7% | -31.8% | -26.9% | 19.7% |
| Other | -1.4% | 1.2% | -2.1% | -37.7% | -25.1% | 11.8% |
| MFG | -2.2% | 3.1% | 2.7% | -35.7% | -24.3% | 10.3% |
| IMPORTS | ||||||
| All IMP | -2.7% | 0.6% | -17.4% | -38.1% | -24.3% | 12.7% |
| Food and Drinks | -6.8% | 6.5% | 1.1% | -11.2% | -8.3% | 14.8% |
| Raw materials | -7.9% | -0.8% | -44.3% | -63.2% | -40.7% | 8.5% |
| Other | -2.1% | 0.3% | -17.2% | -38.1% | -24.4% | 12.8% |
| MFG | -5.9% | 2.7% | -25.4% | -34.7% | -23.5% | 6.7% |
| *Eur mlns; mo or period average | ||||||
More Economy in Brief
 Global| Feb 05 2026
Charts of the Week: Balanced Policy, Resilient Data and AI Narratives
by:Andrew Cates


