 Global| Dec 07 2010
German Domestic Manufacturing New Orders Top Foreign New Orders
Summary
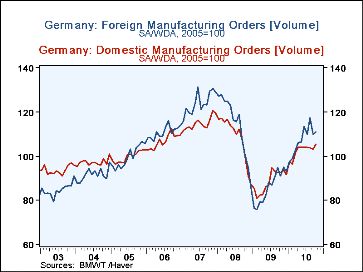
The German economy continues to show strength in the midst of the financial uncertainties of the Euro Area. The volume of manufacturing new orders rose 1.6% in October. Foreign new orders rose only 0.82%, due largely to a 0.28% fall [...]
 The
German economy continues to show strength in the midst of the financial
uncertainties of the Euro Area. The volume of manufacturing new
orders rose 1.6% in October. Foreign new orders rose only 0.82%,
due largely to a 0.28% fall off in demand from other countries in the
Euro Area. Foreign orders from outside the Euro Area, however, were
still increasing and rose 1.4%. Domestic orders rose 2.43% in the
month. Total, domestic and foreign manufacturing new orders
are shown in the first chart.
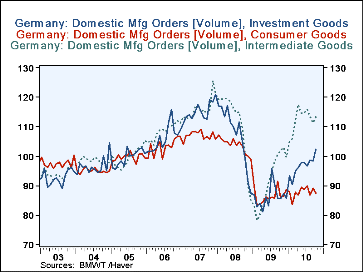
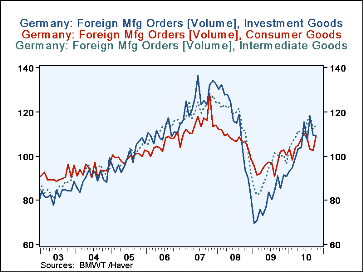
As the economy recovered from the severe recession, domestic new orders were dominated by the demand for intermediate goods--the goods necessary for the production of final products. In more recent months the demand for investment goods has led to a substantial increase in the domestic new orders. Domestic new orders for consumer products have so far shown little growth from the levels reached in the recession. However, rising employment augurs well for increased consumer demand. The second chart shows the domestic new orders for intermediate, investment and consumer goods. The third chart shows the foreign new orders for these same goods.
Foreign new orders for the manufacture of consumer goods and investment goods, in particular, have been stronger than the domestic new orders, as can be seen in a comparison of the second and third charts. However, recent developments suggest that domestic demand may be picking up while foreign demand may be decelerating.
| German New Orders (2005=100) | Oct 10 | Sep 10 | Oct 09 | M/M % | Y/Y % | 2009 | 2008 | 2007 |
| Total | 108.3 | 106.6 | 91.7 | 1.59 | 18.10 | 87.2 | 111.2 | 119.7 |
| Domestic | 105.5 | 103.0 | 92.4 | 2.43 | 14.18 | 88.6 | 108.3 | 114.5 |
| Foreign | 110.7 | 109.8 | 91.1 | 0.82 | 21.50 | 86.1 | 113.8 | 124.0 |
| Other Euro Area Countries | 106.3 | 106.5 | 87.9 | -0.28 | 20.82 | 84.0 | 113.9 | 126.8 |
| Non Euro Area Countries | 123.2 | 121.5 | 95.0 | 1.40 | 29.68 | 89.5 | 120.7 | 126.8 |


