 Global| Sep 08 2009
German Industrial Production Down: New Orders Up In July
Summary
Data on German industrial production were released today. Production in July fell 0.9% from June, contrary to expectations of a continued rise. Production of electricity and other utilities was off 4.0%, construction, 2.4%, mining and [...]
Data on German industrial production were released today.
Production in July fell 0.9% from June, contrary to expectations of a
continued rise. Production of electricity and other utilities was off
4.0%, construction, 2.4%, mining and quarrying, 1.6% and manufacturing
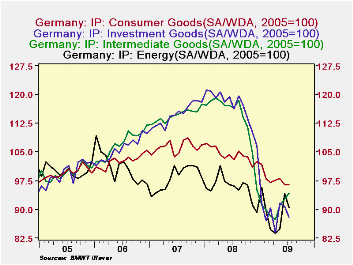
0.5%. In terms of the kind of goods produced, production of consumer
goods was flat, that of investment goods, down 3.2%, and energy
production, down 3.9%. The only positive sector was the production of
intermediate goods, which rose 1.8% suggesting that the inventory
liquidation evident in the second quarter GDP report may be abating or
even reversing. The first chart shows the production of these goods.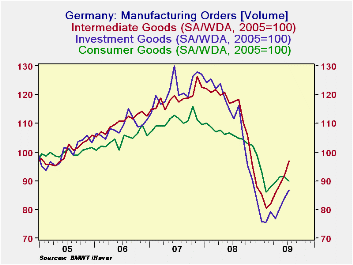
Data on manufacturing new orders were released yesterday and were generally more positive than the production data, but still a little cautionary in some of the details. The total volume of manufacturing new orders increased 3.5% in July, The rise was due entirely to a big increase of 10.3% in domestic new orders. Foreign orders actually fell 2.3%. Orders for intermediate goods increased 5.2% in the month of July while orders for investment goods were up 3.2%; however, orders for consumer goods fell 1.5%. The second chart show the orders for these three types of goods.
| GERMANY | ||||||||
|---|---|---|---|---|---|---|---|---|
| INDUSTRIAL PRODUCTION (2005=100) | Jul 09 | Jun 09 | Jul 08 | M/M % | Y/Y % | 2008 | 2007 | 2006 |
| Electricity and other utilities | 92.4 | 96.2 | 97.6 | -3.95 | -5.23 | 96.3 | 98.0 | 101.4 |
| Construction | 104.2 | 106.7 | 101.8 | -2.34 | 2.36 | 108.2 | 108.9 | 105.8 |
| Mining and Quarrying | 114.2 | 116.1 | 107.2 | -1.64 | 6.43 | 110.4 | 12407 | 95.9 |
| Manufacturing | 91.7 | 95.2 | 113.6 | -0.54 | -19.28 | 113.1 | 112.7 | 105.8 |
| Intermediate Goods | 94.1 | 92.7 | 116.5 | 1.83 | -18.97 | 114.0 | 114.6 | 107.1 |
| Investment Goods | 87.9 | 90.8 | 116.2 | -3.19 | -24.35 | 116.9 | 114.8 | 105.9 |
| Consumer Goods | 96.5 | 96.5 | 102.9 | 0.00 | -6.22 | 104.3 | 106.3 | 102.4 |
| Energy Goods | 90.5 | 94.2 | 96.1 | -3.93 | -5.83 | 95.7 | 98.3 | 100.9 |
| MANUFACTURING NEW ORDERS (2005=100) | ||||||||
| Total | 90.7 | 87.6 | 113.3 | 3.54 | -19.95 | 111.3 | 119.7 | 108.9 |
| Domestic | 95.5 | 86.6 | 110.2 | 10.25 | -13.34 | 108.3 | 114.8 | 106.8 |
| Foreign | 86.5 | 88.5 | 116.0 | -2.26 | -25.43 | 113.8 | 124.0 | 110.8 |
| Intermediate Goods | 97.0 | 9202 | 117.5 | 5.21 | -17.45 | 113.1 | 118.7 | 110.2 |
| Investment Goods | 86.8 | 84.1 | 111.6 | 3.21 | -22.22 | 110.9 | 121.7 | 108.8 |
| Consumer Goods | 89.9 | 91.3 | 105.7 | -1.53 | -14.95 | 105.5 | 110.7 | 104.2 |


