 Global| Dec 07 2009
German Manufacturing New Orders Decline In October
Summary
German manufacturing new orders in volume terms fell 2.14% in October to 91.4 (2005=100) from 93.4 in September. This was the first drop since orders began to rise in March of this year. Domestic orders were down only 0.55% but [...]
 German
manufacturing new orders in volume terms fell 2.14% in October to 91.4
(2005=100) from 93.4 in September. This was the first drop
since orders began to rise in March of this year. Domestic
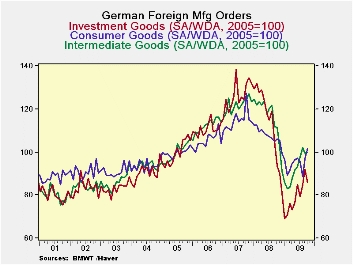
orders were down only 0.55% but foreign orders declined 3.48%. The
continued rise in the Euro is taking its toll on German
exports. A decline of 6.74% in foreign demand for investment
goods accounted for the drop in foreign orders. Foreign orders for
consumer goods actually increased by 5.27% in October and foreign
orders for intermediate goods rose slightly--0.30% . Foreign
orders are shown in the first chart.
German
manufacturing new orders in volume terms fell 2.14% in October to 91.4
(2005=100) from 93.4 in September. This was the first drop
since orders began to rise in March of this year. Domestic
orders were down only 0.55% but foreign orders declined 3.48%. The
continued rise in the Euro is taking its toll on German
exports. A decline of 6.74% in foreign demand for investment
goods accounted for the drop in foreign orders. Foreign orders for
consumer goods actually increased by 5.27% in October and foreign
orders for intermediate goods rose slightly--0.30% . Foreign
orders are shown in the first chart.
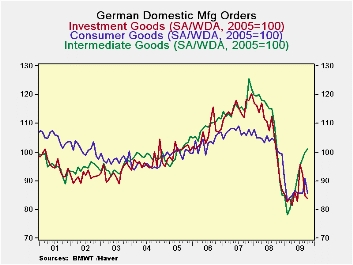 Domestic
demand for investment
goods also declined in October, but only by 1.18%. In
contrast to the rising foreign trend, orders for domestic consumer
goods fell by 5.84%, reflecting lack luster retail sales.
Domestic demand for intermediate goods increased by 1.20%.
Domestic orders are shown in the second chart.
Domestic
demand for investment
goods also declined in October, but only by 1.18%. In
contrast to the rising foreign trend, orders for domestic consumer
goods fell by 5.84%, reflecting lack luster retail sales.
Domestic demand for intermediate goods increased by 1.20%.
Domestic orders are shown in the second chart.
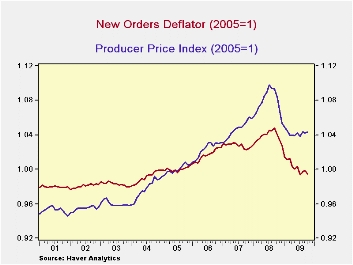 An
indicator of the
price level of new orders can be computed by dividing the value series
by the volume series. The resulting calculation is shown in
the third chart compared with the Producer Price Index for
manufacturing. The two indexes show the same broad
trends. The PPI has been falling since June 2008 and appears
to be leveling off. The new orders index has been declining
since September 2008 and is yet to level off.
An
indicator of the
price level of new orders can be computed by dividing the value series
by the volume series. The resulting calculation is shown in
the third chart compared with the Producer Price Index for
manufacturing. The two indexes show the same broad
trends. The PPI has been falling since June 2008 and appears
to be leveling off. The new orders index has been declining
since September 2008 and is yet to level off.
| Oct 09 | Sep 09 | Oct 08 | M/M % CHG | Y/Y % CHG | 2008 | 2007 | 2006 | |
|---|---|---|---|---|---|---|---|---|
| Manufacturing New Orders | 91.4 | 93.4 | 99.9 | -2.14 | -8.51 | 111.3 | 119.7 | 108.7 |
| Domestic | 91.2 | 91.7 | 99.5 | -0.55 | -8.34 | 108.3 | 114.8 | 106.8 |
| Foreign | 91.5 | 94.8 | 100.2 | -3.48 | -8.77 | 113.8 | 124.0 | 110.8 |
| Foreign New Orders | ||||||||
| Intermediate Goods | 99.8 | 99.5 | 111.6 | 0.30 | -10.57 | 115.9 | 121.7 | 112.2 |
| Investment Goods | 85.8 | 92.0 | 93.7 | -6.74 | -8.43 | 113.5 | 126.2 | 110.7 |
| Consumer Goods | 101.9 | 96.8 | 105.9 | 5.27 | -3.78 | 107.5 | 114.8 | 105.3 |
| Domestic New Orders | ||||||||
| Intermediate Goods | 101.2 | 100.0 | 100.9 | 1.20 | 0.50 | 110.6 | 116.1 | 108.5 |
| Investment Goods | 83.8 | 84.8 | 98.4 | -1.18 | -14.84 | 107.2 | 115.2 | 106.1 |
| Consumer Goods | 85.5 | 90.8 | 100.5 | -5.84 | 14.93 | 103.6 | 107.0 | 103.2 |
| Prices (Value Index/Volume Index,2005=1) | .995 | .999 | 1.011 | -0.44 | -4.47 | 1.038 | 1.028 | 1.017 |
More Economy in Brief

 Global| Feb 05 2026
Charts of the Week: Balanced Policy, Resilient Data and AI Narratives
by:Andrew Cates

