 Global| Sep 01 2009
German Retail Sales Up A Bit In July: Where Are The Auto Sales Resulting From Germany's "Cash For Clunkers" Program?
Summary
Preliminary data show that German retail sales rose 0.7% in volume terms in July after declining in May and June. (Final data for total retail sales plus data on the composition of sales for the month of July will be available in [...]
 Preliminary
data show that German retail sales rose 0.7% in volume
terms in July after declining in May and June. (Final data for total
retail sales plus data on the composition of sales for the month of
July will be available in about two weeks.) The value of
retail sales rose only 0.1%, implying a decline in retail
prices. While the rise in retail sales is encouraging, its
magnitude suggests a pretty lack luster consumer.
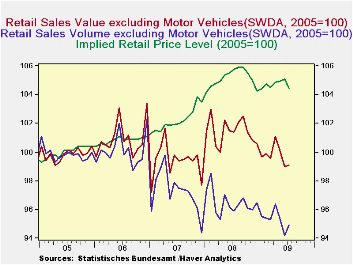
The first chart shows the volume, value and implied price level of
Germany's retail sales.
Perhaps the reason that these data suggest
such a lack luster consumer, is that they do not take into account the
effect of the Government's program, paying people 2,500 Euros if they
scrap their car and buy a new one, which began in January.
German retail sales data exclude sales of motor vehicles. Combined wholesale and retail sales of cars and light trucks are
available in the Manufacturing, Trade & Service Section of the
Haver data base for Germany. This series combining wholesale
sales is not strictly comparable with the retail sales data and is
available only through June. The increase in passenger car
registrations is, perhaps, a better proxy for sales of new cars and
this series, which is not seasonally adjusted, is available through
July. It, too, can be found in the
Manufacturing, Trade & Services section in the Haver data base
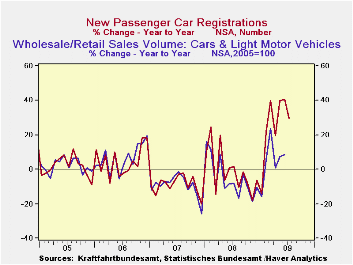
on Germany. The year to year increases in these two series
are shown in the second chart. The year to year
increases in car registrations since January have been particularly
striking and suggest that consumers have a higher propensity to spend
than the retail sales data would suggest.
| Jul 09 | Jun 09 | Jul 08 | M/M % | Y/Y % | 2008 | 2007 | 2006 | |
|---|---|---|---|---|---|---|---|---|
| Retail Sales Volume (2005=100) | 94.9 | 94.2 | -5.9 | 0.74 | -1.04 | 96.5 | 97.2 | 1000.1 |
| Retail Sales Value (2005=100) | 99.1 | 99.0 | 101.4 | 0.10 | -2.27 | 101.4 | 99.4 | 100.9 |
| Retail Sales Implied Price Level (2005=100) | 104.4 | 105.1 | 105.7 | -0.64 | -1.24 | 105.1 | 102.2 | 100.9 |
| Year to Year % Change | Jul 09 | Jun 09 | May 09 | Apr 09 | Mar 09 | Feb 09 | Jan 09 | |
| Wholesale and Retail Sales of Cars and Light Motor Vehicles | n.a. | 8.59 | 7.23 | 0.75 | 23.70 | 5.38 | -15.89 | -- |
| New Passenger Car Registrations | 29.50 | 40.48 | 39.71 | 19.39 | 39.33 | 21.48 | -14.21 | -- |
More Economy in Brief
 Global| Feb 05 2026
Charts of the Week: Balanced Policy, Resilient Data and AI Narratives
by:Andrew Cates


