 Global| Dec 15 2008
Growth in Chinese Industrial Production Slows: A Proxy for GDP Growth
Summary
Chinese industrial production increased 5.4% in November, the smallest increase since 2002. Growth in industrial production declined intermittently for a year after reaching a monthly year to year peak of 19.5% in June, 2007, but in [...]

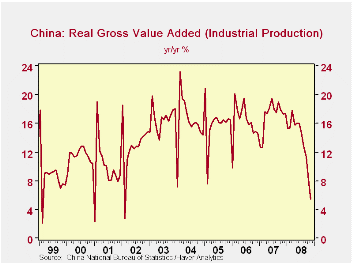
Chinese industrial production increased 5.4% in November, the smallest increase since 2002. Growth in industrial production declined intermittently for a year after reaching a monthly year to year peak of 19.5% in June, 2007, but in the last five months it has been in a free fall, from 16.0% to 5.4%. The year to year changes in the growth of industrial production are shown in the first chart.
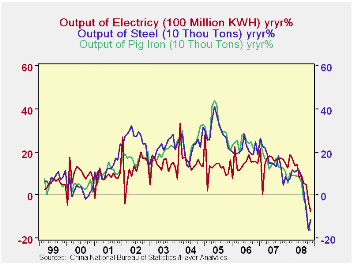
Some of the components of industrial production are showing declines of more than a month for first time. Production of electricity has been down for the last two months, that of steel for the last three months and the of pig iron for the last four months as shown in the second chart.
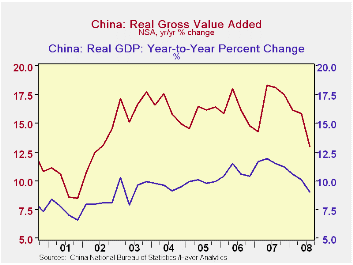
China's National Bureau of Statistics measures industrial production in terms of gross value added in 1990 prices. It is therefore a much broader measure than the indexes of industrial production of most other countries and is a good proxy for Real Gross Domestic Product. The similarity between the trends of the GDP and GVA , shown in the third chart, is apparent. The slow down in industrial production growth in October and November, suggest that the growth in the fourth quarter of GDP will be well below the 9% of the third quarter.


| CHINA
INDUSTRIAL PRODUCTION (GROSS VALUE ADDED) Y/Y PERCENT CHANGE |
Nov 08 | Oct 08 | Sep 08 | Aug 08 | Jul 08 | Jun 08 |
|---|---|---|---|---|---|---|
| Industrial Production | 5.4 | 8.2 | 11.4 | 12.8 | 14.7 | 16.0 |
| Output of Selected Products | ||||||
| Electricity | -7.79 | -3.04 | 4.80 | 5.71 | 9.59 | 8.06 |
| Steel | -11.34 | -16.36 | -7.25 | 2.37 | 8.81 | 11.45 |
| Pig Iron | -16.00 | -16.36 | -4.97 | -1.86 | -5.80 | -8.38 |


