 Global| Jan 15 2007
Growth in New Orders for Ships and Electric Power and for Export Exceed Growth in Japanese Headline Series for New [...]
Summary
The Economic and Social Research Institute (ESRI) of the Cabinet Office in Japan announced today that new orders for machinery were well above expectations. On a seasonally unadjusted basis new orders were 19.3% above November, 2005 [...]
The Economic and Social Research Institute (ESRI) of the Cabinet Office in Japan announced today that new orders for machinery were well above expectations. On a seasonally unadjusted basis new orders were 19.3% above November, 2005 and on a seasonally adjusted basis were 14.22% above October.
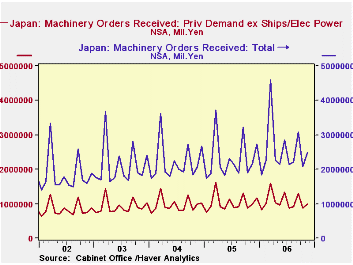
Orders are reported in total in the month they are received even if they are very large and will not be completed for several months; as a result, the series tends to be extremely volatile. ESRI publishes a "Headline" series which excludes two of the most erratic components--ships and electric power. The seasonally unadjusted series for total orders and the seasonally unadjusted Headline Series are shown in the first chart. On a seasonally unadjusted basis the Headline series was 0.7% above November, 2005 and the seasonally adjusted series was 3.8% above October.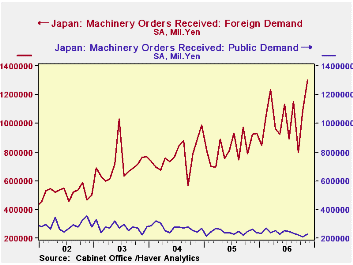
With data through November, we have a good idea of how the current year is fairing vis-à-vis 2005. Total orders for the period January through November, 2006 were 27,963.3 billion yen or 12.6% above the 24,841.8 billion yen in the comparable period in 2005. This represents a substantial increase over the 4.35% increase in 2005 over 2004. The Headline Series shows a different picture. The eleven month total of Headline orders was 11,721.5 billion yen in the current year or only 4.77% above the 11.188.1 billion yen recorded in the January to November period of 2005. Moreover, the indicated increase for 2006 is well below the actual increase of 7.11% in 2005. It would appear that ships and electric power have provided much of the growth in total orders this year. However, the difference between total new orders and the Headline series includes foreign and government orders as well as ships and electric power.
In the second chart showing seasonally adjusted foreign and government orders, it is clear that foreign orders have been an important part of the growth in total orders while government orders have played a slightly negative role.
| JAPAN NEW ORDERS (Bil Yen, ex where noted) |
Nov06 | Oct 06 | Sep 06 | J-N 06 | J-N 05 | J-N 06/ J-N 05% |
2005 % | 2004 % | 2003 % |
|---|---|---|---|---|---|---|---|---|---|
| Total New Orders NAS | 2,482.7 | 2,081.5 | 3,069.2 | 27,963.3 | 24,841.8 | 12.6 | 4.35 | 4.24 | 15.05 |
| Y/Y percent change | 19.27 | -32.18 | 39.20 | -- | -- | -- | -- | -- | -- |
| Total New Orders SA | 2,804.6 | 2,455.6 | 2,319.4 | -- | -- | -- | -- | -- | -- |
| M/M percent change | 14.22 | 5.87 | -12.95 | -- | -- | -- | -- | -- | -- |
| Headline Series NAS | 994.7 | 861.5 | 1,305.3 | 11,721.5 | 11,188.1 | 4.77 | 7.11 | 4.43 | 10.68 |
| Y/Y percent change | 0.70 | -1.18 | -14.7 | -- | -- | -- | -- | -- | -- |
| Headline Series SA | 1,064.2 | 1,025.4 | 997.5 | -- | -- | -- | -- | -- | -- |
| M/M percent change | 3.78 | 2.80 | -7.26 | -- | -- | -- | -- | -- | -- |
| Foreign New Orders | 1,302.5 | 1,088.4 | 795.8 | 11,382.1 | 9024.7 | 26.23 | 6.85 | 9.43 | 37.08 |
| Public New Orders | 229.5 | 209.0 | 223.4 | 2,625.2 | 2,674.9 | -1.82 | 9.80 | -6.44 | -5.13 |


