 Global| Feb 07 2011
Growth In Pacific Rim GDP Accelerates In Q4 2010: Indonesia, The Latest To Report
Summary
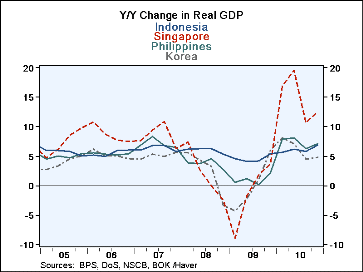
Indonesia is the sixth Pacific Rim country to report an increase in its rate of growth in the fourth quarter of 2010. The other countries are China, Singapore, the Philippines, Korea and Vietnam. The quarterly year to year growth [...]
 Indonesia is the sixth Pacific Rim country to report an increase in its rate of growth in the fourth quarter of 2010.
The other countries are China, Singapore, the Philippines, Korea and Vietnam. The quarterly year to year growth rates for
Indonesia, Korea, Singapore and the Philippines are shown in the attached chart. Only one country, Taiwan, has reported a
deceleration of growth in the fourth quarter, from 9.80% to 6.48%. Hong Kong, India. Macao, Malaysia, Sri Lanka and Thailand
have yet to be heard from.
Most of the countries that have reported experienced rising activity in the first and second quarters but a deceleration of growth in the third quarter. The question at the time was whether the third quarter signaled a change in direction or was merely a pause in the growth of economic activity in Asia. The fourth quarter data, particularly for Indonesia, seems to be favoring the pause option.
The composition of changes in Indonesia's fourth quarter is subject to change, due to the fact that the statistical discrepancy has not been determined. According to the preliminary data, the year to year increase in net exports rose from 1.39% in the third quarter to 14.0% in the fourth. There was also an increase in the growth of government consumption from 4.34% to 8.28%. The remaining items, however, showed decelerations in growth. The growth in in private consumption expenditure decreased from 5.16% to 4.44%, and the growth in expenditures on fixed capital equipment also declined from 9.27% to 8.60%. As the effect of the big swing in inventories from an accumulation of 2,510 billion rupiahs to a liquidation of 1,290 billion rupiahs is to reduce growth, it seems difficult to justify the published total growth. However, the statistical discrepancy is yet to be found. If the statistical discrepancy is found to be positive, it will result in a large increase from the -4,010 billion rupiahs of the third quarter and make a positive contribution to growth. Or it is possible that the growth rates of some of components will be revised upward.
| Q4'10 | Q3'10& | Q2'10 | Q1'10 | 2010 | 2009 | 2008 | 2007 | |
|---|---|---|---|---|---|---|---|---|
| Year to Year change in Real GDP (%) | ||||||||
| Indonesia | 6.83 | 5.83 | 6.19 | 5.69 | 6.14 | 4.55 | 6.01 | 6.35 |
| China | 9.9 | 9.6 | 10.3 | 11.9 | 10.3 | 9.2 | 9.6 | 14.2 |
| Singapore | 12.53 | 10.62 | 19.54 | 16.88 | 14.78 | -1.28 | 1.78 | 8.54 |
| Korea | 4.82 | 4.44 | 7.15 | 8.10 | 6.05 | 0.20 | 2.30 | 5.11 |
| Philippines | 7.09 | 6.30 | 8.15 | 7.82 | 7.33 | 1.06 | 3.69 | 7.09 |
| Vietnam | 6.78 | 5.10 | 5.54 | 5.83 | 6.78 | 5.46 | 6.15 | 8.54 |
| Components of Change in Indonesian Q4 GDP(%) | Q4 | Q3 | ||||||
| Private Consumption Expenditures | 4.44 | 5.16 | ||||||
| Government Consumption Expenditures | 8.28 | 4.34 | ||||||
| Gross Domestic Fixed Capital Expenditures | 8.60 | 9.27 | ||||||
| Change in Stocks (Bil. Rupiahs) | -1290.3 | 2509.7 | ||||||
| Net Exports | 14.00 | 1.39 | ||||||
| Statistical Discrepancy (Bil. Rupiahs) | N.A. | -4070.9 | ||||||
| N.A. Not available. | ||||||||


