 Global| Nov 16 2005
Home Heating Costs Lifted CPI
by:Tom Moeller
|in:Economy in Brief
Summary
The 0.2% rise in the consumer price index (CPI-U) last month was stronger than Consensus expectations for no change in prices following the huge 1.2% spurt in September. Though energy prices declined, the fall was limited to 0.2% due [...]
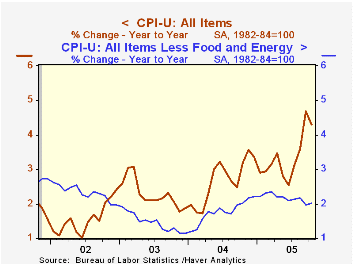
The 0.2% rise in the consumer price index (CPI-U) last month was stronger than Consensus expectations for no change in prices following the huge 1.2% spurt in September.
Though energy prices declined, the fall was limited to 0.2% due to a 14.0% (45.3% y/y) surge in natural gas prices and a 0.9% (35.9% y/y) gain in fuel oil prices. These gains were offset by gasoline prices which moved lower by 4.5% (+37.0% y/y) and in November have declined roughly another 15% m/m to $2.30 per gallon in the latest week. 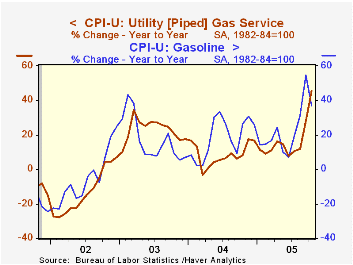
Prices less food & energy rose 0.2%, twice the September increase, but the increase matched Consensus expectations. Core goods prices were unchanged as 0.5% increases in prices for medical commodities (2.6% y/y) and new vehicles (0.9% y/y) were offset by m/m declines in prices for appliances (+2.5% y/y), carpets (-3.5% y/y) and other household equipment (-6.5% y/y). Apparel prices also fell for the sixth month this year (-0.4% m/m, -1.1% y/y) and tobacco prices dropped 0.1% (5.6% y/y).
Core services prices rose 0.3% as shelter prices jumped 0.5% (2.3% y/y) and medical care services prices also rose 0.5% (4.6% y/y). Public transportation prices ballooned 1.4% (7.8% y/y) while school tuition costs rose 0.2% (6.2% y/y).
The chained CPI which adjusts for shifts in the mix of consumer purchases rose 0.3% and less food & energy chain prices rose 0.4%.
Understanding the Inflation Targeting Debate from the Federal Reserve Bank of St. Louis is available here.
| Consumer Price Index | Oct | Sept | Y/Y | 2004 | 2003 | 2002 |
|---|---|---|---|---|---|---|
| Total | 0.2% | 1.2% | 4.3% | 2.7% | 2.3% | 1.6% |
| Total less Food & Energy | 0.2% | 0.1% | 2.0% | 1.8% | 1.5% | 2.3% |
| Goods less Food & Energy | 0.0% | 0.1% | 0.4% | -0.9% | -2.0% | -1.1% |
| Services less Energy | 0.3% | 0.1% | 2.7% | 2.8% | 2.9% | 3.8% |
| Energy | -0.2% | 12.0% | 29.6% | 10.9% | 12.2% | -5.9% |
| Food | 0.3% | 0.3% | 2.2% | 3.4% | 2.1% | 1.8% |
| Chained CPI: Total (NSA) | 0.3% | 0.8% | 3.3% | 2.3% | 2.0% | 1.3% |
| Total less Food & Energy | 0.4% | 0.2% | 1.7% | 1.5% | 1.1% | 1.9% |
by Tom Moeller November 16, 2005
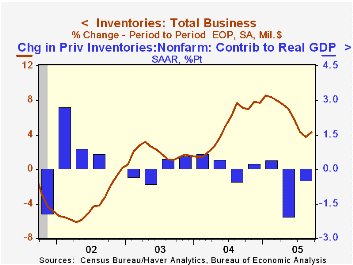
Total business inventories in September added 0.5% to the prior month's 0.4% rise. The gains marked the strongest consecutive monthly increases since February & March yet they failed to reverse the decline in the ratio of inventories-to-sales which fell to a new record low. The I/S ratio fell to 1.25 as business sales increased 0.6% (7.8% y/y).
The 0.9% rise in retail inventories repeated its August increase due to a 2.1% jump in motor vehicle inventories. Excluding autos, inventories rose 0.4% as clothing inventories rose 0.5% (5.7% y/y) and general merchandise increased 0.4% (6.9% y/y). Furniture inventories fell 0.3% (+5.7% y/y) for the third consecutive down month.
Factory sector inventories fell for the second consecutive month.
Wholesale inventories increased 0.6%. During the last ten years there has been a 64% correlation between the y/y change in wholesale inventories and the change in imports of merchandise.
| Business Inventories | Sept | Aug | Y/Y | 2004 | 2003 | 2002 |
|---|---|---|---|---|---|---|
| Total | 0.5% | 0.4% | 4.3% | 7.7% | 1.4% | 1.6% |
| Retail | 0.9% | 0.9% | 1.1% | 5.7% | 3.9% | 5.9% |
| Retail excl. Autos | 0.4% | 0.6% | 6.0% | 5.9% | 2.0% | 2.3% |
| Wholesale | 0.6% | 0.5% | 8.0% | 10.8% | 2.0% | 1.2% |
| Manufacturing | -0.2% | -0.1% | 4.9% | 7.7% | -1.1% | -5.4% |
by Tom Moeller November 16, 2005
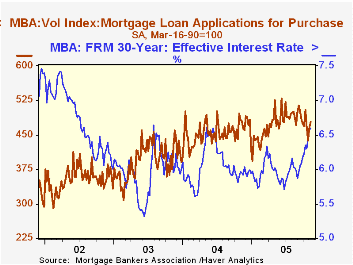
The total number of mortgage applications fell 0.6% last week after a 2.3% gain the prior period, according to the Mortgage Bankers Association. The decline left the average level in November 4.4% below October.
Applications to refinance fell sharply for the fourth consecutive week. The 5.4% drop lowered the November average 11.1% versus October's.
Purchase applications rose 2.6% for the second consecutive weekly gain and the rise lifted applications in November 0.5% above October. During the last ten years there has been a 49% correlation between the y/y change in purchase applications and the change in new plus existing single family home sales.
The effective interest rate on a conventional 30-year mortgage was about stable at 6.59% but that was up versus June low of 5.81%. The effective rate on a 15-year mortgage was 6.18%. The interest rates on 15 and 30 year mortgages are closely correlated (>90%) with the rate on 10 year Treasury securities.
The Mortgage Bankers Association surveys between 20 to 35 of the top lenders in the U.S. housing industry to derive its refinance, purchase and market indexes. The weekly survey accounts for more than 40% of all applications processed each week by mortgage lenders. Visit the Mortgage Bankers Association site here.
Bubbling (or Just Frothy) House Prices? from the Federal Reserve Bank of St. Louis can be found here.
| MBA Mortgage Applications (3/16/90=100) | 11/11/05 | 11/04/05 | Y/Y | 2004 | 2003 | 2002 |
|---|---|---|---|---|---|---|
| Total Market Index | 657.6 | 661.3 | -13.3% | 735.1 | 1,067.9 | 799.7 |
| Purchase | 477.9 | 465.7 | -0.5% | 454.5 | 395.1 | 354.7 |
| Refinancing | 1,702.4 | 1,798.8 | -28.3% | 2,366.8 | 4,981.8 | 3,388.0 |
by Carol Stone November 16, 2005
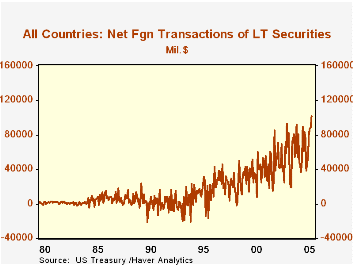
Foreign investors continued to increase their participation in US securities markets in September, according to the US Treasury's monthly Treasury International Capital ("TIC") data reported this morning. For the first time, net purchases of major marketable securities surpassed $100 billion, reaching $101.9 billion. As evident in the table below, just two years ago, monthly average purchases were only about half this amount.
The TIC data, carried in Haver's USINT database, constitute a sizable body of information about interest in US markets from investors in many countries around the world. Many observers look to these data as a way of gauging the ease with which foreign capital flows "finance" the now enormous US current account deficit. Indeed, as we have pointed out here before, there is a high correlation of these investment flows with the size of that deficit.
However, one aspect that strikes us this month is the variety contained in the transactions. While the volume in US Treasuries look fairly steady in our table, in individual months they have ranged from a net liquidation of $3.2 billion (February 2003) to net purchases in excess of $50 billion (each March and April 2004). Other securities categories show even more variability. Perhaps the only repeated pattern is a consistent liquidation of foreign stocks that trade in US markets.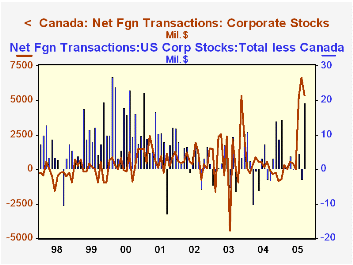
There is also great variability among the nations represented. A quick glance at a list of the countries and their purchases of various instruments shows much up and down movement in most any combination. Such wide-ranging changes highlight the fact that these transactions are generated by thousands of individual investment decisions. For example, total net purchases of US corporate stocks surged from $3.8 billion in August to $24.6 billion in September. Canadian investors bought about the same amount in each of these months: $6.6 billion in August and $5.4 billion in September. So other investors were obviously net sellers in the former month, but switched to making sizable purchases in the latter. Canadians, in the meantime, had bought $1.7 billion on net of US corporate bonds in August, but reduced their activity in these bonds to nearly zero in September. Thus, multiple investment motivations must be at work among these diverse financial market participants. Further, we'd hazard a guess that any "financing" of the current account is more likely to be reflected in short-term financial instruments, such as flows of bank deposits, commercial paper and trade credit. Some of these data are also contained in the USINT database as "banking liabilities to foreigners" and "nonbanking liabilities to foreigners. Those liabilities, some of which are published only quarterly and available only through Q2, have grown rapidly over the past year, as one might expect, but more examination of these relationships is needed to form firmer conclusions on the origins of these flows.
| Net Foreign Purchases of Securities in US Markets (Billions US$) |
Sept 2005 | Aug 2005 | July 2005 | Last 12 Months' Average | Monthly Average|||
|---|---|---|---|---|---|---|---|
| 2004 | 2003 | 2002 | |||||
| Total | 101.9 | 89.0 | 87.3 | 71.5 | 63.6 | 55.3 | 47.9 |
| Treasuries | 21.8 | 28.2 | 28.5 | 25.7 | 29.3 | 22.0 | 10.0 |
| Federal Agencies (mostly "GSEs") | 20.6 | 15.7 | 37.8 | 20.8 | 18.9 | 13.0 | 16.3 |
| US Corporate Bonds | 51.1 | 40.2 | 24.7 | 30.3 | 25.8 | 22.1 | 15.2 |
| US Corporate Stocks | 24.6 | 3.8 | 10.0 | 7.4 | 2.4 | 2.9 | 4.2 |
| Foreign Bonds | -9.1 | 17.1 | -5.1 | -2.9 | -5.7 | 2.7 | 2.4 |
| Foreign Stocks | -7.0 | -13.5 | -8.7 | -9.8 | -7.1 | -7.4 | -0.1 |

Tom Moeller
AuthorMore in Author Profile »Prior to joining Haver Analytics in 2000, Mr. Moeller worked as the Economist at Chancellor Capital Management from 1985 to 1999. There, he developed comprehensive economic forecasts and interpreted economic data for equity and fixed income portfolio managers. Also at Chancellor, Mr. Moeller worked as an equity analyst and was responsible for researching and rating companies in the economically sensitive automobile and housing industries for investment in Chancellor’s equity portfolio. Prior to joining Chancellor, Mr. Moeller was an Economist at Citibank from 1979 to 1984. He also analyzed pricing behavior in the metals industry for the Council on Wage and Price Stability in Washington, D.C. In 1999, Mr. Moeller received the award for most accurate forecast from the Forecasters' Club of New York. From 1990 to 1992 he was President of the New York Association for Business Economists. Mr. Moeller earned an M.B.A. in Finance from Fordham University, where he graduated in 1987. He holds a Bachelor of Arts in Economics from George Washington University.
More Economy in Brief

 Global| Feb 05 2026
Charts of the Week: Balanced Policy, Resilient Data and AI Narratives
by:Andrew Cates

