 Global| Nov 16 2005
Home Heating Costs Lifted CPI
by:Tom Moeller
|in:Economy in Brief
Summary
The 0.2% rise in the consumer price index (CPI-U) last month was stronger than Consensus expectations for no change in prices following the huge 1.2% spurt in September. Though energy prices declined, the fall was limited to 0.2% due [...]
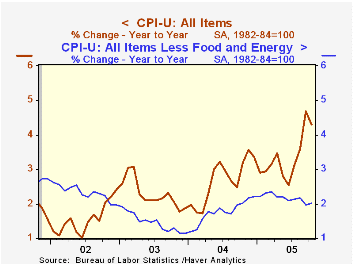
The 0.2% rise in the consumer price index (CPI-U) last month was stronger than Consensus expectations for no change in prices following the huge 1.2% spurt in September.
Though energy prices declined, the fall was limited to 0.2% due to a 14.0% (45.3% y/y) surge in natural gas prices and a 0.9% (35.9% y/y) gain in fuel oil prices. These gains were offset by gasoline prices which moved lower by 4.5% (+37.0% y/y) and in November have declined roughly another 15% m/m to $2.30 per gallon in the latest week. 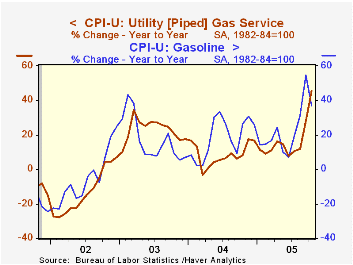
Prices less food & energy rose 0.2%, twice the September increase, but the increase matched Consensus expectations. Core goods prices were unchanged as 0.5% increases in prices for medical commodities (2.6% y/y) and new vehicles (0.9% y/y) were offset by m/m declines in prices for appliances (+2.5% y/y), carpets (-3.5% y/y) and other household equipment (-6.5% y/y). Apparel prices also fell for the sixth month this year (-0.4% m/m, -1.1% y/y) and tobacco prices dropped 0.1% (5.6% y/y).
Core services prices rose 0.3% as shelter prices jumped 0.5% (2.3% y/y) and medical care services prices also rose 0.5% (4.6% y/y). Public transportation prices ballooned 1.4% (7.8% y/y) while school tuition costs rose 0.2% (6.2% y/y).
The chained CPI which adjusts for shifts in the mix of consumer purchases rose 0.3% and less food & energy chain prices rose 0.4%.
Understanding the Inflation Targeting Debate from the Federal Reserve Bank of St. Louis is available here.
| Consumer Price Index | Oct | Sept | Y/Y | 2004 | 2003 | 2002 |
|---|---|---|---|---|---|---|
| Total | 0.2% | 1.2% | 4.3% | 2.7% | 2.3% | 1.6% |
| Total less Food & Energy | 0.2% | 0.1% | 2.0% | 1.8% | 1.5% | 2.3% |
| Goods less Food & Energy | 0.0% | 0.1% | 0.4% | -0.9% | -2.0% | -1.1% |
| Services less Energy | 0.3% | 0.1% | 2.7% | 2.8% | 2.9% | 3.8% |
| Energy | -0.2% | 12.0% | 29.6% | 10.9% | 12.2% | -5.9% |
| Food | 0.3% | 0.3% | 2.2% | 3.4% | 2.1% | 1.8% |
| Chained CPI: Total (NSA) | 0.3% | 0.8% | 3.3% | 2.3% | 2.0% | 1.3% |
| Total less Food & Energy | 0.4% | 0.2% | 1.7% | 1.5% | 1.1% | 1.9% |

Tom Moeller
AuthorMore in Author Profile »Prior to joining Haver Analytics in 2000, Mr. Moeller worked as the Economist at Chancellor Capital Management from 1985 to 1999. There, he developed comprehensive economic forecasts and interpreted economic data for equity and fixed income portfolio managers. Also at Chancellor, Mr. Moeller worked as an equity analyst and was responsible for researching and rating companies in the economically sensitive automobile and housing industries for investment in Chancellor’s equity portfolio. Prior to joining Chancellor, Mr. Moeller was an Economist at Citibank from 1979 to 1984. He also analyzed pricing behavior in the metals industry for the Council on Wage and Price Stability in Washington, D.C. In 1999, Mr. Moeller received the award for most accurate forecast from the Forecasters' Club of New York. From 1990 to 1992 he was President of the New York Association for Business Economists. Mr. Moeller earned an M.B.A. in Finance from Fordham University, where he graduated in 1987. He holds a Bachelor of Arts in Economics from George Washington University.
More Economy in Brief


