 Global| Apr 10 2020
Housing Affordability Rises in February Boosted by Lower Rates
Summary
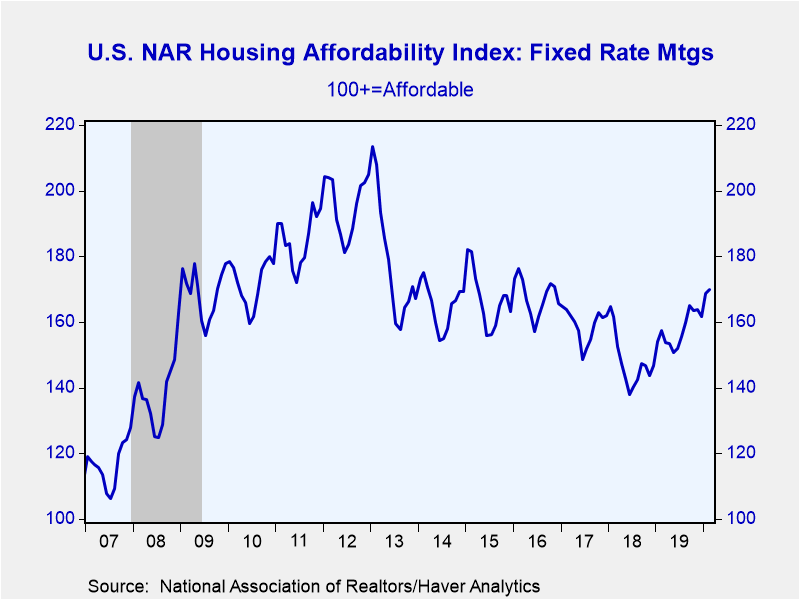
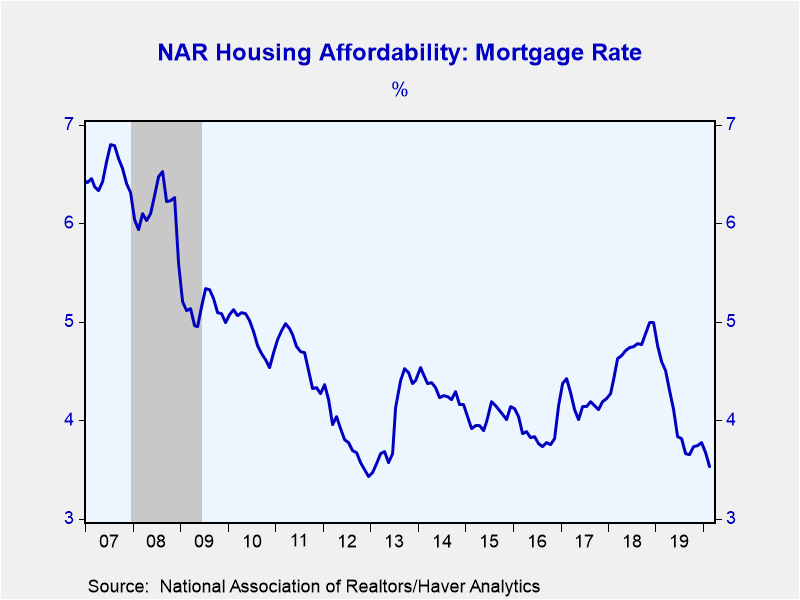
• Housing affordability increased in February to its highest rate since late 2016. • Lower mortgage rates and rising incomes offset higher home prices. The National Association of Realtors reported that its Fixed Rate Mortgage Housing [...]
• Housing affordability increased in February to its highest rate since late 2016.
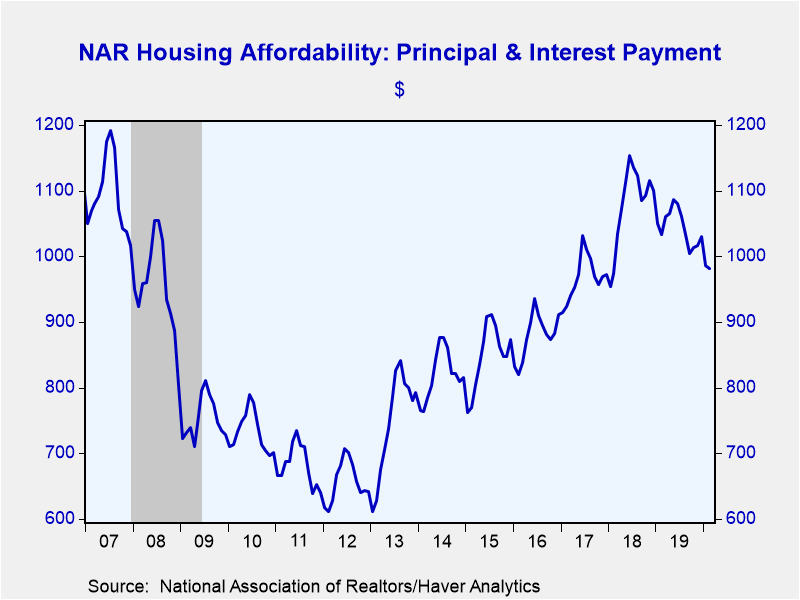
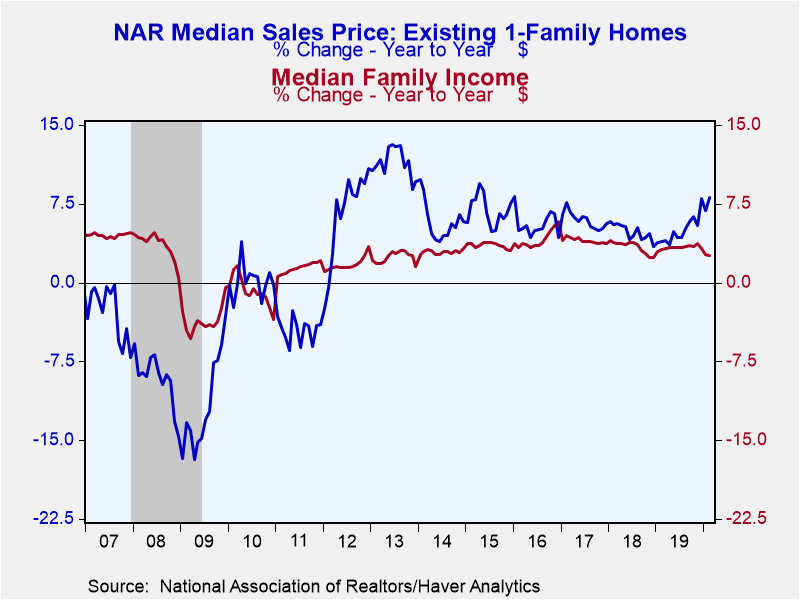
• Lower mortgage rates and rising incomes offset higher home prices.
The National Association of Realtors reported that its Fixed Rate Mortgage Housing Affordability Index gained 0.8% (7.9% y/y) to 170.0 in February, its highest level since November 2016.
In February, the effective mortgage interest rate declined 15 basis points to 3.53%. Monthly principal and interest payments decreased to $982 from $986 in January. With incomes continuing to rise the share of income devoted to mortgage payments edged down 14.7%, the lowest level since September 2016. The median single family home sales price, which was already reported last month, increased 8.1% y/y to $272,400. Median family incomes, which are projected by the National Association of Realtors, rose 2.6% y/y to $80,117.
The Housing Affordability Index equals 100 when median family income qualifies for an 80% mortgage on a median-priced existing single-family home. A rising index indicates an increasing number of buyers can qualify for a mortgage to purchase the median-priced home. Data on Home Affordability can be found in Haver's REALTOR database. Median sales prices are located in USECON. Higher frequency interest rate data can be found in SURVEYSW, WEEKLY, and DAILY.
| Housing Affordability | Feb | Jan | Dec | Y/Y% | 2019 | 2018 | 2017 |
|---|---|---|---|---|---|---|---|
| Fixed Rate Housing Affordability Index | 170.0 | 168.6 | 161.7 | 7.9 | 157.6 | 147.9 | 159.1 |
| Payment as a Percent of Income | 14.7 | 14.8 | 15.5 | 15.9 | 15.9 | 16.9 | 15.7 |
| Principal and Interest Payment ($) | 982 | 986 | 1,030 | -4.9 | 1,044 | 1,079 | 967 |
| Monthly Fixed Mortgage Rate (%) | 3.53 | 3.68 | 3.78 | 4.60 | 4.04 | 4.72 | 4.20 |
| Median Family Income ($) | 80,117 | 79,796 | 79,931 | 2.6 | 78,959 | 76,401 | 73,891 |
| Median Sales Price (Existing Single Family Home, $) | 272,400 | 268,500 | 277,000 | 8.1 | 272,333 | 259,458 | 247,508 |
Gerald D. Cohen
AuthorMore in Author Profile »Gerald Cohen provides strategic vision and leadership of the translational economic research and policy initiatives at the Kenan Institute of Private Enterprise.
He has worked in both the public and private sectors focusing on the intersection between financial markets and economic fundamentals. He was a Senior Economist at Haver Analytics from January 2019 to February 2021. During the Obama Administration Gerald was Deputy Assistant Secretary for Macroeconomic Analysis at the U.S. Department of Treasury where he helped formulate and evaluate the impact of policy proposals on the U.S. economy. Prior to Treasury, he co-managed a global macro fund at Ziff Brothers Investments.
Gerald holds a bachelor’s of science from the Massachusetts Institute of Technology and a Ph.D. in Economics from Harvard University and is a contributing author to 30-Second Money as well as a co-author of Political Cycles and the Macroeconomy.
More Economy in Brief
 Global| Feb 05 2026
Charts of the Week: Balanced Policy, Resilient Data and AI Narratives
by:Andrew Cates


