 Global| May 11 2021
Housing Affordability Rises in March
by:Sandy Batten
|in:Economy in Brief
Summary
• Incomes boosted in March by another round of government stimulus payments. • Both prices and mortgage rates rise in March. The National Association of Realtors' Fixed Rate Mortgage Housing Affordability Index increased 1.3% in March [...]
• Incomes boosted in March by another round of government stimulus payments.
• Both prices and mortgage rates rise in March.
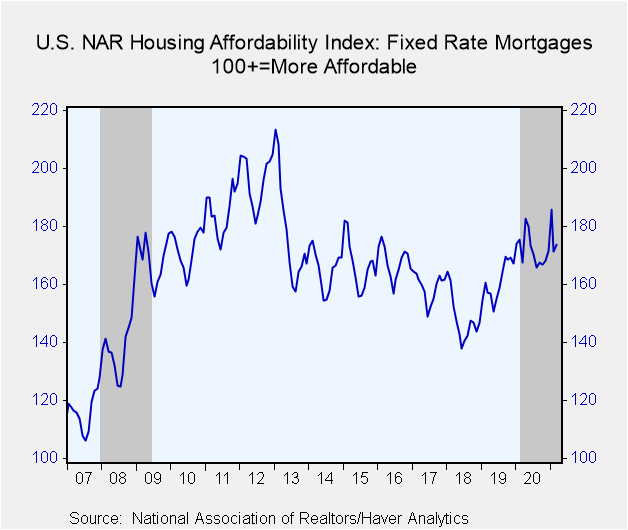
The National Association of Realtors' Fixed Rate Mortgage Housing Affordability Index increased 1.3% in March to 173.6 from a downwardly revised 171.3 in February (initially 173.1). It was 3.5% higher than a year ago. When the Housing Affordability Index equals 100, this means that a family earning the median income can qualify for an 80% mortgage on a median-priced existing single-family home. An index above 100 indicates that a family earning the median income has more than enough income to qualify for an 80% mortgage loan on a median-priced home. This index has been above 100 in each month since June 1989, reaching its all-time high of 213.3 in January 2013.
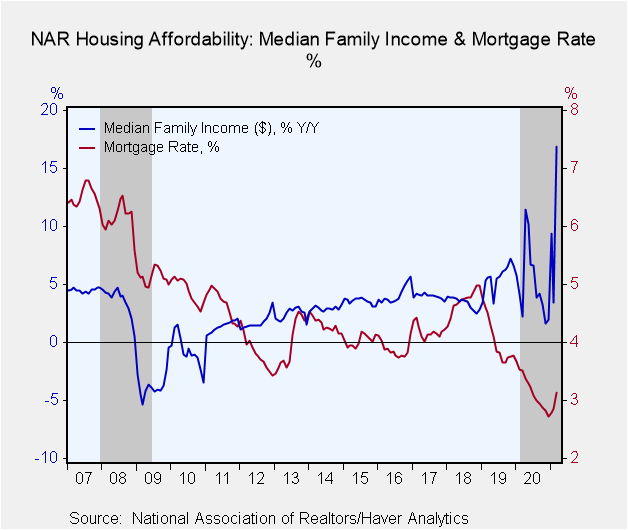
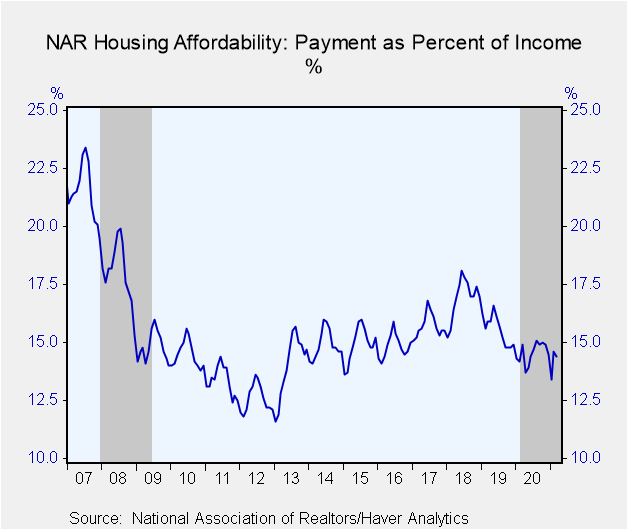
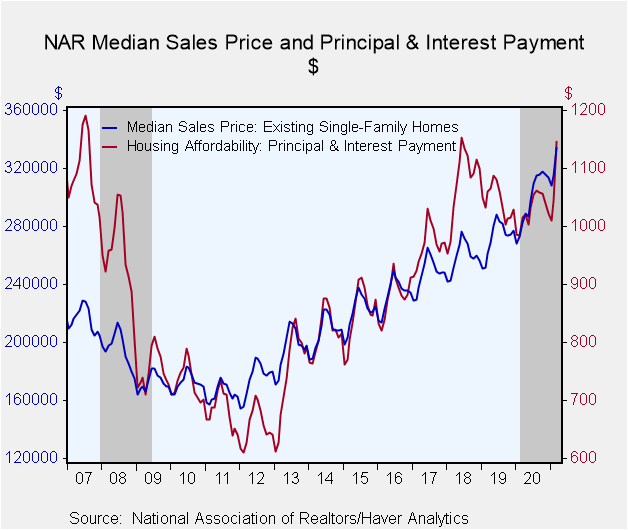
In February, median family income jumped up 11.4% m/m, boosted by the third round of stimulus checks from the federal government, after having fallen 4.9% in February. House prices continued their ascent, with the median sales price for an existing single-family home rising 6.2% m/m in March, its largest monthly increase since March 2013, to $334,500. The effective mortgage interest rate increased 27 basis points to 3.13% in March, its highest level since June 2020 and largest monthly increase since December 2016. The rise in the median house prices combined with the rise in the mortgage rate pushed up the monthly payment by 9.9% m/m to $1,147 in March, its largest monthly increase in the series history dating back to 1981. This represented 14.4% of median income, down from 14.6% in February.
Data on Housing Affordability can be found in Haver's REALTOR database. Median sales prices are located in USECON. Higher frequency interest rate data can be found in SURVEYW, WEEKLY, and DAILY.
| Housing Affordability | Mar | Feb | Jan | Y/Y% | 2020 | 2019 | 2018 |
|---|---|---|---|---|---|---|---|
| Fixed Rate Mortgage Housing Affordability Index (100+=More Affordable) | 173.6 | 171.3 | 186.0 | 3.5 | 172.0 | 161.1 | 147.9 |
| Payment as a Percent of Income | 14.4 | 14.6 | 13.4 | 14.9 | 14.5 | 15.5 | 17.0 |
| Principal and Interest Payment ($) | 1,147 | 1,044 | 1,011 | 12.9 | 1,028 | 1,044 | 1,079 |
| Monthly Mortgage Rate (%) | 3.13 | 2.86 | 2.79 | 3.51 | 3.17 | 4.04 | 4.72 |
| Median Family Income ($) | 95,585 | 85,817 | 90,239 | 16.9 | 84,843 | 80,704 | 76,401 |
| Median Sales Price (Existing Single-Family Home, $) | 334,500 | 315,100 | 308,000 | 18.4 | 298,708 | 272,333 | 259,458 |
Sandy Batten
AuthorMore in Author Profile »Sandy Batten has more than 30 years of experience analyzing industrial economies and financial markets and a wide range of experience across the financial services sector, government, and academia. Before joining Haver Analytics, Sandy was a Vice President and Senior Economist at Citibank; Senior Credit Market Analyst at CDC Investment Management, Managing Director at Bear Stearns, and Executive Director at JPMorgan. In 2008, Sandy was named the most accurate US forecaster by the National Association for Business Economics. He is a member of the New York Forecasters Club, NABE, and the American Economic Association. Prior to his time in the financial services sector, Sandy was a Research Officer at the Federal Reserve Bank of St. Louis, Senior Staff Economist on the President’s Council of Economic Advisors, Deputy Assistant Secretary for Economic Policy at the US Treasury, and Economist at the International Monetary Fund. Sandy has taught economics at St. Louis University, Denison University, and Muskingun College. He has published numerous peer-reviewed articles in a wide range of academic publications. He has a B.A. in economics from the University of Richmond and a M.A. and Ph.D. in economics from The Ohio State University.
More Economy in Brief
 Global| Feb 05 2026
Charts of the Week: Balanced Policy, Resilient Data and AI Narratives
by:Andrew Cates


