Global| Nov 17 2005
Industrial Output Rebounded in October
by:Tom Moeller
|in:Economy in Brief
Summary
Industrial output last month rebounded 0.9% following the effects of Hurricane's Katrina & Rita which lowered September output by a revised 1.5%. The increase about matched Consensus expectations for a 1.0% gain. Another sharp decline [...]
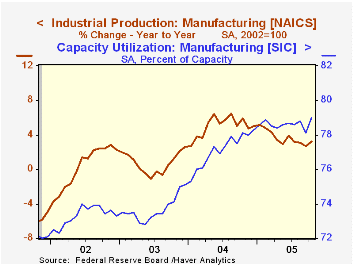
Industrial output last month rebounded 0.9% following the effects of Hurricane's Katrina & Rita which lowered September output by a revised 1.5%. The increase about matched Consensus expectations for a 1.0% gain.
Another sharp decline of 1.9% in utility output (+1.3% y/y) which followed two consecutive months of 0.9% drop held back the gain in total output. Mining output (-0.6%) also fell for the fourth consecutive month (-8.1% y/y). These declines were offset by a 1.5% spurt in factory sector production (3.3% y/y) which more than recovered the prior month's 0.7% shortfall.
A huge 6.5% (8.5% y/y) gain in output of business equipment led the strength in factory output last month. The strength was paced by a 36.8% rise in transit equipment which was recovering from a 25.5% plunge in September. Output of computers, peripheral equipment & semiconductors also were strong and rose 1.7% (24.8% y/y) led by a 2.8% jump in communications equipment (23.2% y/y). Excluding the high tech sector altogether, factory output gained 1.3% (1.8% y/y).
Output of appliances, furniture & carpeting fell 0.6% (+3.5% y/y) but output of nonenergy, nondurables rose 0.2% (1.6% y/y) led by a 0.6% (0.8% y/y) increase in chemical production. Clothing output fell 2.5% (-2.2% y/y).
Total capacity utilization rose to 79.5% and capacity grew 1.6% y/y. Factory sector utilization rose to 79.0% while capacity rose 2.0% y/y. Figures for both output and capacity were upwardly revised
| Production & Capacity | Oct | Sept | Y/Y | 2004 | 2003 | 2002 |
|---|---|---|---|---|---|---|
| Industrial Production | 0.9% | -1.5% | 2.0% | 4.1% | 0.6% | 0.1% |
| Consumer Goods | -0.4% | 0.5% | 2.0% | 2.1% | 1.0% | 2.2% |
| Business Equipment | 6.5% | -4.6% | 8.5% | 9.3% | 0.0% | -7.8% |
| Capacity Utilization | 79.5% | 78.9% | 79.2% (10/04) | 78.6% | 75.7% | 75.2% |
by Tom Moeller November 17, 2005
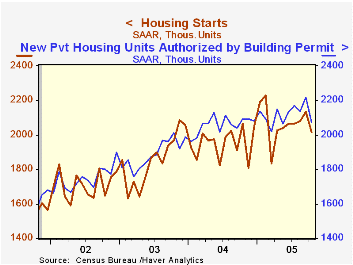
Housing starts in October fell 5.6% m/m to 2.014M units following an upwardly revised gain in September.The drop was to the lowest level since March and compared to Consensus expectations for a lesser decline to 2.06M starts.
The 3.7% decline in single-family starts reversed all of an upwardly revised 3.0% increase in September. Single family starts fell hard throughout the country. A 6.7% decline (-7.1% y/y) in the West was accompanied by a 7.2% drop (-6.6% y/y) in the Midwest. In the Northeast, single family starts were notably weak and fell 8.5% (+3.2% y/y) to the lowest level since April. Only an unchanged reading (11.6% y/y) in the South tempered the declines..
Multi family starts cratered 14.8% m/m after a downwardly revised 0.6% increase in September.
Building permits fell a hard 6.7% m/m to the lowest level since April as single family permits fell 4.9% (+4.9% y/y).
China: An Evolving Housing Market from the Federal Reserve Bank of San Francisco is available here.
| Housing Starts (000s, AR) | Oct | Sept | Y/Y | 2004 | 2003 | 2002 |
|---|---|---|---|---|---|---|
| Total | 2,014 | 2,134 | -2.3% | 1,950 | 1,854 | 1,7 10 |
| Single-family | 1,704 | 1,770 | 2.3% | 1,604 | 1,505 | 1,363 |
| Multi-family | 310 | 364 | -21.7% | 345 | 349 | 347 |
| Building Permits | 2,071 | 2,219 | -1.1% | 2,058 | 1,8 88 | 1,749 |
by Tom Moeller November 17, 2005
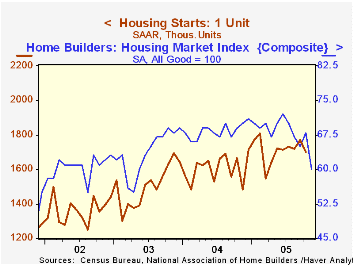
The National Association of Home Builders' (NAHB) Composite Housing Market Index fell a hard 11.8% in November to 60, the lowest level since May 2003.
During the last twenty years the y/y change in the annual composite index has had an 85% correlation with the change in single family housing starts and there has been a 75% correlation between the current sales index and new single family home sales.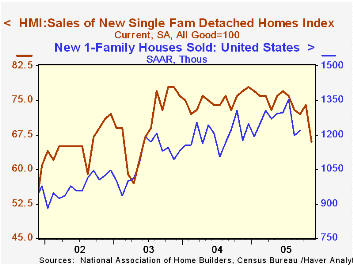
The m/m drop reflected sharp declines throughout the country.
The index for current sales of single family homes in November fell sharply to the lowest level since May 2003. The index for sales in six months also fell hard the lowest in over two years.
The NAHB index is a diffusion index based on a survey of builders. Readings above 50 signal that more builders view conditions as good than poor.
Visit the National Association of Home Builders.
| Nat'l Association of Home Builders | Nov | Oct | Nov '04 | 2004 | 2003 | 2002 |
|---|---|---|---|---|---|---|
| Composite Housing Market Index | 60 | 68 | 70 | 68 | 64 | 61 |
by Tom Moeller November 17, 2005
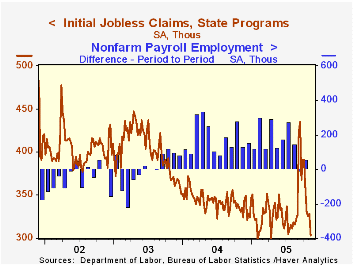
A 25,000 decline last week in initial claims for unemployment insurance to 303,000 followed a little revised 3,000 increase the prior week and dropped claims to the lowest level since mid-April. Consensus expectations had been for a lesser decline 320,000 claims.
The latest figure covers the survey period for November nonfarm payrolls and claims were down 54,000 (15.1%) from the October period.
The Labor Department indicated that roughly 10,000 new claims last week were related to hurricanes Katrina and Rita, bringing the total since Sept. 3 linked to the Gulf Coast storms to an unadjusted 545,000 claims. Hurricane Wilma, which struck Florida late last month, led to roughly 9,000 claims bringing the total to 16,400 related claims since that storm hit.
The four-week moving average of initial claims fell sharply to 321,500 (-4.2% y/y), the lowest level since early September.
Continuing claims for unemployment insurance rose 3,000 following a downwardly revised 5,000 drop during the prior week.
The insured rate of unemployment remained at 2.2% for the eighth week.
Spendthrift Nation from the Federal Reserve Bank of San Francisco can be found here.
| Unemployment Insurance (000s) | 11/12/05 | 11/05/05 | Y/Y | 2004 | 2003 | 2002 |
|---|---|---|---|---|---|---|
| Initial Claims | 303 | 328 | -9.8% | 343 | 402 | 404 |
| Continuing Claims | -- | 2,793 | 0.3% | 2,926 | 3,531 | 3,570 |
by Carol Stone November 17, 2005
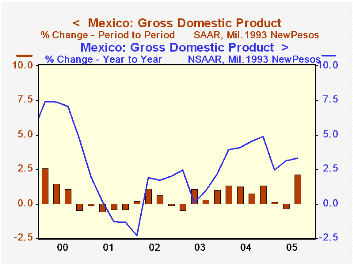
Mexico's GDP was either strong or weak in Q3, according to who you listen to and which comparisons you make. The data were reported yesterday afternoon by INEGI, Mexico's statistical agency. The year-on-year gain of 3.3% was less than a government forecast, Reuters explained, but slightly larger than private market forecasts. Seasonally adjusted, the quarter saw a 2.1% increase (quarterly rate) after a basically flat performance in Q1 (+0.2%) and Q2 (-0.3%). It was this pattern that Dow Jones highlighted, with a headline in the Wall Street Journal that read "Mexico Growth Picks Up...". 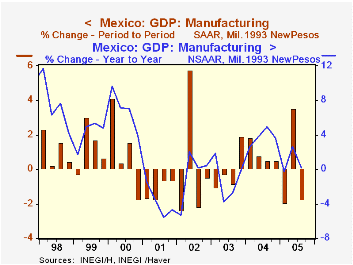
A further divergence of interpretation concerns manufacturing. This important sector has experienced considerable variability in recent years. From Q3 2004, this latest period's value added rose a mere 0.2%, less than Q2's 2.6% yearly increase. The retreat was led by metals and metal products. Based on seasonal adjustment of the industry data by Haver Analytics, these, along with "other manufacturing", showed considerable quarter-to-quarter declines. Some attribute this to weakness in the US motor vehicle industry, although collateral data, such as unit vehicle imports into the US as published by the US Commerce Department, don't indicate any decline. At the same time, for the entire factory sector, some analysts apparently feared a decrease from a year earlier, so the 0.2% rise, modest as it is, was of some comfort.
Other notable sectors of the Mexican economy contributed to the mixed reading on its health. Agriculture, constituting a relatively small proportion of total GDP, had a substantial increase in Q3, 10.6% year-to-year after outright declines in the first half of 2005. Finance also strengthened, with a 6.2% increase; this industry group has been expanding consistently over the last couple of years. The largest sector of the Mexican economy is domestic trade and tourism, contributing just under 20% of GDP last year. This year, it continues to expand, but more slowly, with a 3.1% yearly increase in Q3, notably less than the 4.9% in 2004. As we face Q4, cross-currents will continue to raise questions for the nation: the storms in October, continuing uncertainty in the big US vehicle market, and volatile energy markets. Stay tuned.
| Mexico GDP & Select Industries, % Changes, NSA unless noted |
Q3 2005 | Q2 2005 | Q1 2005 | 2004 | 2003 | 2002 |
|---|---|---|---|---|---|---|
| Real GDP, SA (100%*) | 2.1 | -0.3 | 0.2 | -- | -- | -- |
| Yr/Yr, NSA | 3.3 | 3.1 | 2.4 | 4.4 | 1.4 | 0.8 |
| Agriculture (5.3%*) | 10.6 | -3.3 | -1.5 | 4.0 | 3.5 | 0.1 |
| Manufacturing (18.2%*) | 0.2 | 2.6 | -0.2 | 3.8 | -1.3 | -0.7 |
| Wholesale & Retail Trade/Restaurants & Hotels (19.8%*) |
3.1 | 3.5 | 3.3 | 4.9 | 1.6 | 0.0 |
| Finance/Insurance/ Banking (15.9%*) |
6.2 | 5.5 | 5.1 | 4.6 | 3.9 | 4.2 |

Tom Moeller
AuthorMore in Author Profile »Prior to joining Haver Analytics in 2000, Mr. Moeller worked as the Economist at Chancellor Capital Management from 1985 to 1999. There, he developed comprehensive economic forecasts and interpreted economic data for equity and fixed income portfolio managers. Also at Chancellor, Mr. Moeller worked as an equity analyst and was responsible for researching and rating companies in the economically sensitive automobile and housing industries for investment in Chancellor’s equity portfolio. Prior to joining Chancellor, Mr. Moeller was an Economist at Citibank from 1979 to 1984. He also analyzed pricing behavior in the metals industry for the Council on Wage and Price Stability in Washington, D.C. In 1999, Mr. Moeller received the award for most accurate forecast from the Forecasters' Club of New York. From 1990 to 1992 he was President of the New York Association for Business Economists. Mr. Moeller earned an M.B.A. in Finance from Fordham University, where he graduated in 1987. He holds a Bachelor of Arts in Economics from George Washington University.
More Economy in Brief
 Global| Feb 05 2026
Charts of the Week: Balanced Policy, Resilient Data and AI Narratives
by:Andrew Cates